Bug #40002
openmds: not trim log under heavy load
100%
Description
ceph version 14.2.1
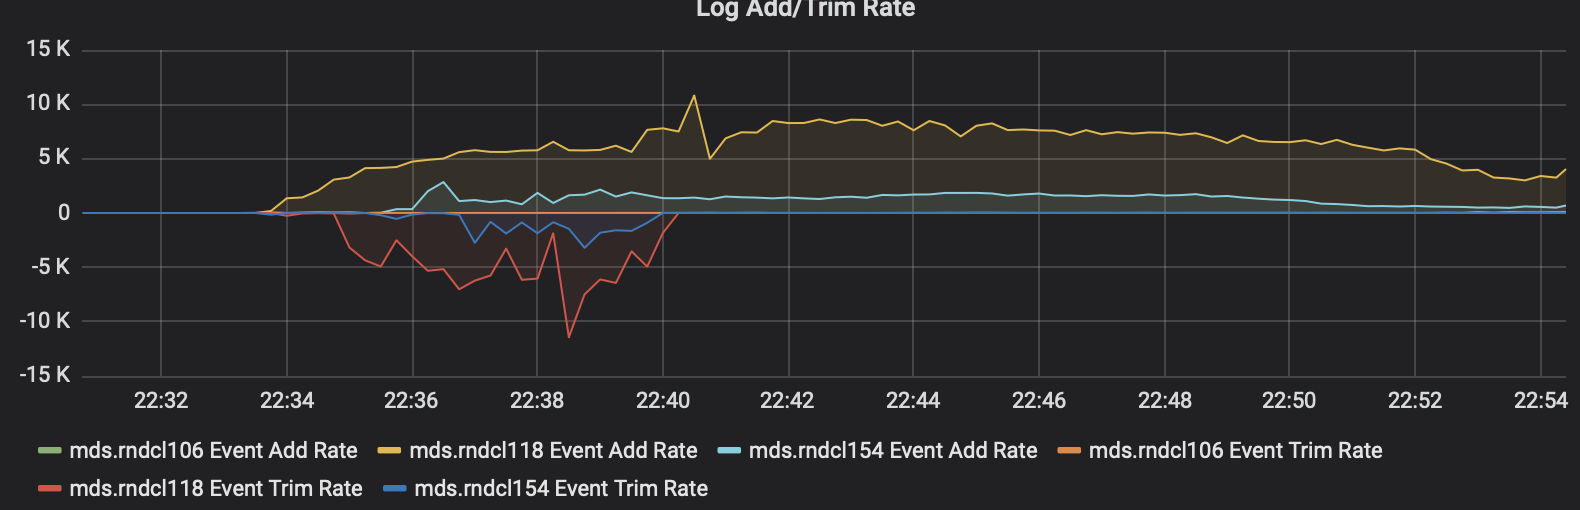
we have 3 mds under a heavy load (create 8k files per second)
we find mds log add very fast almost 8k/s
At first mds log trim normally, after 10 minutes, the mds log stop trim and metadata pool grow very fast. Finally cause metadata pool full.
Files
Updated by Yunzhi Cheng almost 5 years ago
Zheng Yan wrote:
multiple-active mds?
yes
Updated by Patrick Donnelly almost 5 years ago
- Subject changed from mds not trim log under heavy load to mds: not trim log under heavy load
- Target version changed from v14.2.1 to v15.0.0
- Start date deleted (
05/22/2019) - Source set to Community (user)
- Backport set to nautilus,mimic
Updated by Xiubo Li over 2 years ago
- Related to Bug #52280: Mds crash and fails with assert on prepare_new_inode added
Updated by Xiubo Li over 2 years ago
The implementations of the Mutex (e.g. std::mutex in C++) do not guarantee fairness, they do not guarantee that the lock will be acquired by threads in the order that they called the lock().
In most case this works well, but in overload case the client requests handling thread and _submit_thread could always successfully acquire the submit_mutex in a long time, which could make the MDLog::trim() get stuck. That means the MDS daemons will fill journal logs into the metadata pool, but couldn't trim the expired segments in time.
We have hit this before in https://tracker.ceph.com/issues/51722, which is for `mds_lock`.
To fix it we will switch the `submit_mutex` to fair mutex to make sure all the `submit_mutex` waiters could get a change to be excuted in time.
Updated by Xiubo Li over 2 years ago
- Backport changed from nautilus,mimic to pacific
Updated by Xiubo Li over 2 years ago
- Affected Versions v17.0.0 added
- Affected Versions deleted (
v14.2.1)
Updated by Xiubo Li over 2 years ago
- Status changed from In Progress to Fix Under Review
- Pull request ID set to 44215
Updated by Xiubo Li over 2 years ago
- Related to Bug #53542: Ceph Metadata Pool disk throughput usage increasing added
Updated by Xiubo Li over 2 years ago
There has one case that could lead the journal logs to fill the metadata pool full, such as in case of tracker #53597:
For example, if a ClientA keeps one directory opening and in another ClientB just deletes it, the MDS will try to delete it but will just stuck and keeps the related dentry in the stray directory by submitting one Update("unlink_local") journal log event to one log segmentA.
But the ClientA will hold some capabilities of the CInode, so the segmentA couldn't be successfully expired and trimmed until the ClientA release those capabilities. That means all the segments after segmentA couldn't be expired and trimmed too. Thus will cause the MDLog segments keep increasing and the usage of metadata pool keep increasing.
Updated by Xiubo Li over 2 years ago
Xiubo Li wrote:
There has one case that could lead the journal logs to fill the metadata pool full, such as in case of tracker #53597:
For example, if a ClientA keeps one directory opening and in another ClientB just deletes it, the MDS will try to delete it but will just stuck and keeps the related dentry in the stray directory by submitting one Update("unlink_local") journal log event to one log segmentA.
But the ClientA will hold some capabilities of the CInode, so the segmentA couldn't be successfully expired and trimmed until the ClientA release those capabilities. That means all the segments after segmentA couldn't be expired and trimmed too. Thus will cause the MDLog segments keep increasing and the usage of metadata pool keep increasing.
The above case is not correct.
I have reproduced it locally by:
1, set max_mds = 2
2, mount a fuse client
3, then create a lot of directories and distributed pin it to mds.1 at the same time by using:
   $ mkdir lxb ; setfattr -n ceph.dir.pin -v 1 lxb

   $ for i in {0..2500}; do mkdir lxb/dir_$i; setfattr -n ceph.dir.pin -v 1 lxb/dir_$i; done
4, then run:
    $ ceph fs status

    a - 2 clients
    =
    RANK   STATE    MDS     ACTIVITY     DNS    INOS   DIRS CAPS
      0     active    c   Reqs:    0 /s   579    582    111 261
      1    stopping   b                  2012   2015   2014 3464
          POOL        TYPE     USED  AVAIL
     cephfs.a.meta  metadata  90.9M  98.9G
     cephfs.a.data    data       0   98.9G
     STANDBY MDS
              a
It shows the usage of the metadata pool is 90.9MB, it's should be normal.
5, then set max_mds = 1 and then run:
    $ ceph fs status

    a - 2 clients
    =
    RANK   STATE    MDS     ACTIVITY     DNS    INOS   DIRS CAPS
     0     active    c   Reqs:    0 /s  2012   2015   2014 3464
     1    stopping   b                  1613   1616   1615 4
         POOL        TYPE     USED  AVAIL
    cephfs.a.meta  metadata  8488M  96.2G
    cephfs.a.data    data       0   96.2G
    STANDBY MDS
         a
The usage of the metada pool grows sharply and at last it will be 28GB:
    RANK  STATE   MDS     ACTIVITY     DNS    INOS   DIRS   CAPS
     0    active   a   Reqs:    0 /s  2513   2516   2515      2
         POOL        TYPE     USED  AVAIL
    cephfs.a.meta  metadata  28.0G  89.5G
    cephfs.a.data    data       0   89.5G
    STANDBY MDS
         b
6, From cephfs-journal-tool:
  $ cephfs-journal-tool --rank=a:0 header get
    {
        "magic": "ceph fs volume v011",
        "write_pos": 9554043702,
        "expire_pos": 4194304,
        "trimmed_pos": 4194304,
        "stream_format": 1,
        "layout": {
            "stripe_unit": 4194304,
            "stripe_count": 1,
            "object_size": 4194304,
            "pool_id": 2,
            "pool_ns": ""
        }
    }
The write_pos is in the 2278th Rados object, while the trimmed_pos keeps in the second object.
7, From:
    $ rados -p cephfs.a.meta ls | grep '200\.00' | wc -l

     2397
If I do the above steps again and again the metadata pool usage keeps growing as above.
Checked the mds.0 logs:
...
563970 2021-12-15T17:48:41.429+0800 146cba420700 10 mds.0.log submit_entry also starting new segment: last = 3354/42835772, event seq = 3672
563971 2021-12-15T17:48:41.429+0800 146cba420700  7 mds.0.log _prepare_new_segment seq 3673
...
572886 2021-12-15T17:48:43.060+0800 146cba420700 10 mds.0.log submit_entry also starting new segment: last = 3673/18446744073709551615, event seq = 4696
572887 2021-12-15T17:48:43.060+0800 146cba420700  7 mds.0.log _prepare_new_segment seq 4697
...
583368 2021-12-15T17:48:45.105+0800 146cba420700 10 mds.0.log submit_entry also starting new segment: last = 4697/18446744073709551615, event seq = 5720
583369 2021-12-15T17:48:45.105+0800 146cba420700  7 mds.0.log _prepare_new_segment seq 5721
...
609918 2021-12-15T17:49:03.406+0800 146cba420700 10 mds.0.log submit_entry also starting new segment: last = 5721/1573670016, event seq = 6638
609919 2021-12-15T17:49:03.406+0800 146cba420700  7 mds.0.log _prepare_new_segment seq 6639
...
From above we can see that why starting the two new segments with seqs `4697` and `5721` is that the `ls->num_event >= 1024`, the `1024` is the `mds_log_events_per_segment`.
But from the 4th segment's `ls->offset` - 1st segment's `ls->offset`, the range is `(1573670016−42835772)/4MB = 364.9` Rados Objects, that means for the above two new segments with seqs `4697` and `5721`, their average size could be `364.9 x 4MB / 2 = 1.42GB / 2 = 0.71GB`. Just in this case the total journal logs could occupy up to 0.71GB x 128 = 91.2GB metadata pool space, the `128` is `mds_log_max_segments`.
What has caused this ?
Currently for the mds/MDLog, the `submit_mutex` is an unfair mutex. The implementations of the Mutex (e.g. std::mutex in C++) do not guarantee fairness, they do not guarantee that the lock will be acquired by threads in the order that they called the lock().
In most case this works well, but in heavy load case the client requests handling thread and _submit_thread could always successfully acquire the submit_mutex in a long time, which could make the MDLog::trim() get stuck. That means the MDS daemons will fill journal logs into the metadata pool, but couldn't trim the expired segments in time. Or the _submit_entry could always successfully acquire the submit_mutex, the _submit_thread thread will stuck for a while.
For the second case above could cause the current LogSegment's num_event growing but the ls->offset couldn't be updated by _submit_thread until later it could acquire the submit_mutex. From the logs we can see that some events size, such as the ESubtreeMap, could reach up to 1MB:
657940 2021-12-15T17:49:39.389+0800 146cb8a13700  5 mds.0.log _submit_thread 2480027743~41 : EImportFinish 0x200000000a3 success
657941 2021-12-15T17:49:39.400+0800 146cb8a13700  5 mds.0.log _submit_thread 2480027804~919866 : ESubtreeMap 1046 subtrees , 1044 ambiguous [metablob 0x1, 1047 dirs]
657942 2021-12-15T17:49:39.401+0800 146cb8a13700  5 mds.0.log _submit_thread 2480947690~41 : EImportFinish 0x2000000006c success
657943 2021-12-15T17:49:39.410+0800 146cb8a13700  5 mds.0.log _submit_thread 2480947751~918987 : ESubtreeMap 1045 subtrees , 1043 ambiguous [metablob 0x1, 1046 dirs]
So in worse case the event's size could be larger than 1MB, such as 20MB. That means the LogSegment size could reach up to `20MB x 1024 = 20GB`. So the journal logs could occupy `20GB x 128 = 2560GB` disk space from the metadata pool.
So after swtiching the submit_mutex to a fair mutex [1] and with the improving PR [2], it will be much better.
[1] : https://github.com/ceph/ceph/pull/44215
[2] : https://github.com/ceph/ceph/pull/44180
Updated by Xiubo Li over 2 years ago
More logs:
 8614 2021-12-16T10:02:42.596+0800 14c148b75700  5 mds.0.log _submit_thread 2829812324~1725281 : ESubtreeMap 1653 subtrees , 1651 ambiguous [metablob 0x1, 1973 dirs]
 8615 2021-12-16T10:02:42.597+0800 14c148b75700  5 mds.0.log _submit_thread 2831537625~520 : EImportStart 0x2000000000f from mds.1 [metablob 0x2000000000f, 1 dirs]
 8616 2021-12-16T10:02:42.624+0800 14c148b75700  5 mds.0.log _submit_thread 2831538165~1724401 : ESubtreeMap 1652 subtrees , 1650 ambiguous [metablob 0x1, 1972 dirs]
The `ESubtreeMap` event will be inserted to each new LogSegment when starting a new one. The above logs was reproduced by creating 2000 diretories by using:
# ceph fs set a max_mds 2
# mkdir lxb; setfattr -n ceph.dir.pin -v 1 lxb
# for i in {0..2000}; do mkdir lxb/dir2_$i; setfattr -n ceph.dir.pin -v 1 lxb/dir2_$i; done
# ceph fs set a max_mds 1
If I create more directories the size of the `ESubtreeMap` event will reach up to more than 4MB, that means each LogSegment will only contain the `ESubtreeMap` event, that's all. So this is buggy.