Bug #23379
closedrgw performance regression for luminous 12.2.4
0%
Description
Hi, there are two bugs with regard to rgw gateway.
One is related to dynamic sharding, it will block all requests under pressure test.
Another one is when disable dynamic sharding, runing pressure test(like cosbench) for a while(.i.e, ten minutes), qps will decrease rapidly(25000->5000). I can confirm that it is related to gateway because when restart gateway, qps will recover immediately.
These two situations are very easy to reproduce.
Files
.png)
Updated by wei jin about 6 years ago
We tuned rados cluster and closing rgw dynamic sharding, and benchmarked radosgw performance again. We got the same result (qps will decrease rapidly, but after restarting gateway, it will recover).
We deployed six gateways, seems all of them are ok. So where might be the bottleneck or regression?
Updated by Casey Bodley about 6 years ago
Have you looked at radosgw's memory usage? There was an issue with memory growth in https://tracker.ceph.com/issues/23207 that may be related.
Updated by wei jin about 6 years ago
Casey Bodley wrote:
Have you looked at radosgw's memory usage? There was an issue with memory growth in https://tracker.ceph.com/issues/23207 that may be related.
I tried flame graph and found that tcmalloc costs too much time during performance regression. However, I am not sure whether there are other factors that affect the performance. I will try that patch later to verify.
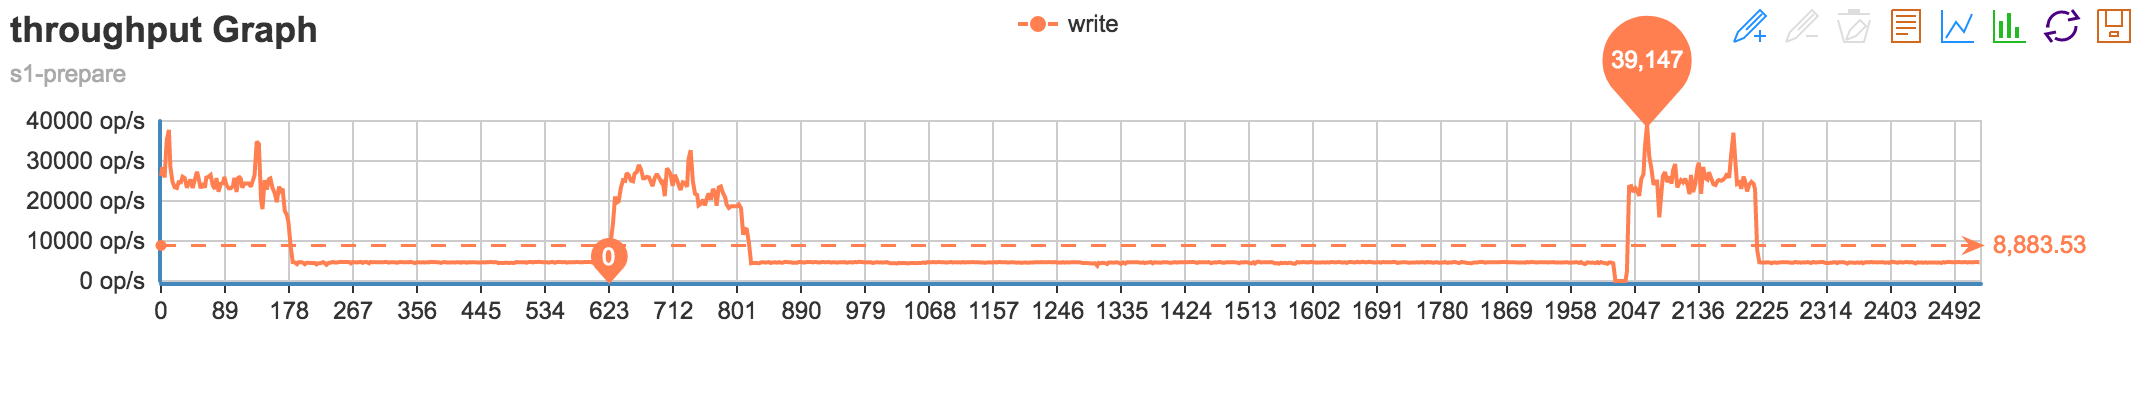
Updated by wei jin about 6 years ago
- File throughput Graph.png throughput Graph.png added
I tried patch (https://github.com/ceph/ceph/pull/20953) with one gateway, still the same problem.
Updated by Mark Kogan about 6 years ago
@wei jin, Is it possible to share the cosbench workload xml please (redacting ip addresses/keys/passwords...)
To see the workload parameters like number of objects and object sizes, etc,
And I will try to run this workload on our system and check.
Updated by wei jin about 6 years ago
<?xml version="1.0" encoding="UTF-8" ?>
<workload name="s3-sample" description="sample benchmark for s3">

  <storage type="s3" config="accesskey=FOO;secretkey=BAR;endpoint=http://IP:PORT" />

  <workflow>

    <workstage name="init">
      <work type="init" workers="1" config="cprefix=s3testqwer;containers=r(1,1)" />
    </workstage>

    <workstage name="prepare">
      <work type="prepare" workers="1024" config="cprefix=s3testqwer;containers=r(1,1);objects=r(1,100000000);sizes=c(32)KB" />
    </workstage>

  </workflow>

</workload>
Here it is. I tried it yesterday with one gateway using s3 protocol. A few days ago, I tried 6 gateways using swift client.
Seems both s3/swift clients have performance regression.
Updated by Mark Kogan about 6 years ago
Thank you,
To summarize the workload -
1024 cosbench workers are writing 32KB objects into a single bucket.
Is it possible to please share the ceph.conf also to see the configured threads number and other tunables?
Updated by wei jin about 6 years ago
[global]
fsid = c105ca4e-b864-46d1-8ab2-74e0dd8b966a
public_network = 10.15.49.0/24
mon_initial_members = n15-049-194, n15-049-208, n15-049-222
mon_host = 10.15.49.194,10.15.49.208,10.15.49.222
auth_cluster_required = cephx
auth_service_required = cephx
auth_client_required = cephx
osd_pool_default_size = 3
osd_pool_default_min_size = 1
mon_osd_down_out_interval = 2592000
rgw_override_bucket_index_max_shards = 65521
rgw_dynamic_resharding = false
rgw_bucket_index_max_aio = 256
rgw_num_rados_handles = 8
rgw_thread_pool_size = 512
rgw_cache_lru_size = 1000000
rgw_gc_max_objs = 1000
rgw_gc_obj_min_wait = 0
rgw_gc_processor_period = 0
#rgw_max_chunk_size = 4194304
debug_asok = 0/0
debug_auth = 0/0
debug_bluefs = 0/0
debug_bluestore = 0/0
debug_buffer = 0/0
debug_civetweb = 0/0
debug_client = 0/0
debug_context = 0/0
debug_crush = 0/0
debug_filer = 0/0
debug_filestore = 0/0
debug_finisher = 0/0
debug_heartbeatmap = 0/0
debug_journal = 0/0
debug_journaler = 0/0
debug_lockdep = 0/0
debug_log = 0
debug_mds = 0/0
debug_mds_balancer = 0/0
debug_mds_locker = 0/0
debug_mds_log = 0/0
debug_mds_log_expire = 0/0
debug_mds_migrator = 0/0
debug_mon = 0/0
debug_monc = 0/0
debug_ms = 0/0
debug_objclass = 0/0
debug_objectcatcher = 0/0
debug_objecter = 0/0
debug_osd = 0/0
debug_paxos = 0/0
debug_perfcounter = 0/0
debug_rados = 0/0
debug_rbd = 0/0
debug_rgw = 0/0
debug_rocksdb = 0/0
debug_throttle = 0/0
debug_timer = 0/0
debug_tp = 0/0
debug_zs = 0/0
[mon]
mon_clock_drift_allowed = 1
mon_osd_full_ratio = 0.90
mon_osd_nearfull_ratio = 0.75
[mds]
mds_log_max_expiring = 200
mds_cache_size = 100000000
mds_client_prealloc_inos = 100000
mds_beacon_grace = 200
mds_beacon_interval = 10
mds_session_timeout = 300
mds_reconnect_timeout = 100
[osd]
ms_dispatch_throttle_bytes = 1048576000
objecter_inflight_ops = 10000
objecter_inflight_op_bytes = 1048576000
osd_client_message_cap = 10000
osd_client_message_size_cap = 1048576000
osd_max_write_size = 512
osd_num_op_tracker_shard = 64
osd_scrub_during_recovery = false
osd_scrub_sleep = 2
osd_scrub_min_interval = 2592000
osd_scrub_max_interval = 5184000
osd_scrub_begin_hour= 2
osd_scrub_end_hour= 8
osd_scrub_load_threshold = 5
osd_recovery_max_active = 1
osd_op_thread_timeout = 280
osd_op_thread_suicide_timeout = 300
osd_recovery_thread_timeout = 280
osd_recovery_thread_suicide_timeout = 300
osd_op_threads = 4
osd_disk_threads = 2
osd_op_num_threads_per_shard = 2
osd_op_num_shards = 8
osd_pg_object_context_cache_count = 10000
osd_map_cache_size = 1024
bluestore_min_alloc_size_ssd = 32768
bluestore_bluefs_balance_interval = 30
bluestore_cache_trim_interval = 60
bluestore_cache_size_ssd = 10737418240 #10g
bluestore_throttle_bytes = 53687091200 #512m
bluestore_throttle_deferred_bytes = 107374182400 #1g
bluestore_cache_kv_max = 2147483648 #2g
bluestore_rocksdb_options =compression=kNoCompression,max_write_buffer_number=32,min_write_buffer_number_to_merge=2,recycle_log_file_num=32,compaction_style=kCompactionStyleLevel,write_buffer_size=67108864,target_file_size_base=67108864,max_background_compactions=31,level0_file_num_compaction_trigger=8,level0_slowdown_writes_trigger=32,level0_stop_writes_trigger=64,num_levels=7,max_bytes_for_level_base=536870912,compaction_threads=32,flusher_threads=8
bluefs_buffered_io = true
bluestore_csum_type = none
#bluestore_min_alloc_size = 65536
#bluestore_extent_map_shard_max_size = 200
#bluestore_extent_map_shard_target_size = 100
#bluestore_extent_map_shard_min_size = 50
[client.rgw.n15-049-194]
rgw_frontends = "civetweb port=80 num_threads=512 enable_keep_alive=yes request_timeout_ms=50000"
Updated by wei jin about 6 years ago
rgw_gc_max_objs = 1000
rgw_gc_obj_min_wait = 0
rgw_gc_processor_period = 0
gc related configs may be ignored, I just want to test trim speed (my requirement is described here: https://github.com/ceph/ceph/pull/20546). Reset them to default values could reproduce the issue too.
Updated by Mark Kogan about 6 years ago
Thank you very much,
I see that there are 512 RGW threads and 1024 cosbench workers,
is it possible to test with a reduced number of cosbench workers
(less than RGW threads), for example, 500 cosbench workers?
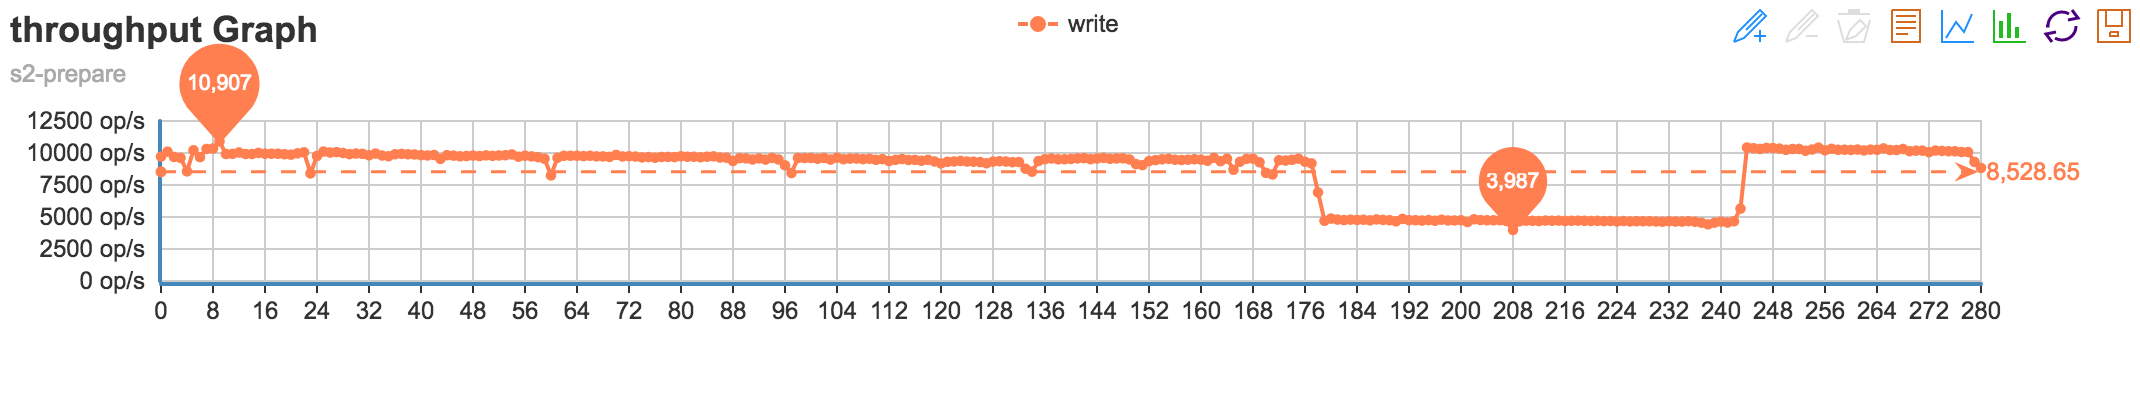
Updated by wei jin about 6 years ago
- File throughput Graph (1).png throughput Graph (1).png added
1. comment gc related configures
2. restart all daemons (mon/osd/rgw)
3. change cosbench worker to 500 and create a newly bucket for test
Still reproduced the regression, after restarting rgw daemon, qps recovered again :(
Updated by Mark Kogan about 6 years ago
Thank you very much for testing and providing all the information,
I will run the workload on my test system, to try to reproduce and investigate.
Compared to which version is the regression? (Jewel ?)
Updated by wei jin about 6 years ago
Mark Kogan wrote:
Compared to which version is the regression? (Jewel ?)
Actually this is my first time to test luminous (newly deployed cluster, not upgraded). All OSDs are using SSD disk, total 250+.
It might be more reasonable to use 'performance issue' instead of 'performance regression' in the title, sorry for the confusion.
Updated by Matt Benjamin about 6 years ago
rgw_num_rados_handles > 1 is not advisable (after change, need to scale up inflight_ops and inflight_op_bytes to compensate)
Updated by wei jin about 6 years ago
Matt Benjamin wrote:
rgw_num_rados_handles > 1 is not advisable (after change, need to scale up inflight_ops and inflight_op_bytes to compensate)
Tried with rgw_num_rados_handles = 1, still reproduced the performance issue.
Updated by Mark Kogan about 6 years ago
I checked if this reproduces on two different clusters
(one with HDDs and one with SSDs)
using some of the provided ceph.conf [rgw] parameters that (I could configure on my cluster)
and the provided cosbench workload.
On my clusters, I did not see the performance degradation as described in this bug.
The ceph.conf customizations in the provided ceph.conf are very extensive,
The cause can possibly be configurations parameters that I can not use on my setup.
I would try to see if it happens also with a relatively small number of cosbench workers like 100,
and if so try to bisect the ceph.conf by commenting various tunings and re-checking,
it's possible that some parameter/s are over-tuned.
Updated by wei jin about 6 years ago
How long have you been running for the cosbench?
The issue might be related to memory usage according to flame graph I gathered before.
I tuned TCMALLOC_MAX_TOTAL_THREAD_CACHE_BYTES of file /etc/default/ceph, and compared 128MB (default) and 256MB, 256MB was much better, but both can reproduce it.
Updated by Mark Kogan about 6 years ago
Very interesting, please tell how do you generate the flame graph, I will perform the same check on my system and update.
Updated by wei jin about 6 years ago
git clone https://github.com/brendangregg/FlameGraph

perf record -e cpu-clock --call-graph dwarf -p 3481456 -- sleep 30  #3481456 is gateway pid

perf script | ./FlameGraph/stackcollapse-perf.pl > rgw-perf.out

./FlameGraph/flamegraph.pl rgw-perf.out > rgw.svg
Updated by Mark Kogan almost 6 years ago
I was able to reproduce this and traced it back to the "rgw_cache_expiry_interval" parameter, the default value is 900 seconds.
If its possible please verify that it mitigates the issue on your system by increasing the value like below in ceph.conf :
rgw_cache_expiry_interval = 9000
Updated by Mark Kogan almost 6 years ago
Following internal discussion and verification on the test system
While we are debugging the issue its currently recommended to disable the cache expiry by
setting the interval to 0 in ceph.conf :
rgw_cache_expiry_interval = 0
Updated by wei jin almost 6 years ago
Mark Kogan wrote:
Following internal discussion and verification on the test system
While we are debugging the issue its currently recommended to disable the cache expiry by
setting the interval to 0 in ceph.conf :rgw_cache_expiry_interval = 0
Thanks. I was just wondering why not set it to zero.
I am sorry I have no test cluster available to verify it now, may try it later.
Updated by Mark Kogan almost 6 years ago
- Status changed from New to In Progress
Updated by Casey Bodley almost 6 years ago
- Status changed from In Progress to Pending Backport
- Backport set to luminous mimic
Updated by Nathan Cutler almost 6 years ago
- Copied to Backport #24632: luminous: rgw performance regression for luminous 12.2.4 added
Updated by Nathan Cutler almost 6 years ago
- Copied to Backport #24633: mimic: rgw performance regression for luminous 12.2.4 added
Updated by Nathan Cutler over 5 years ago
- Status changed from Pending Backport to Resolved