Bug #23119
openMD5-checksum of the snapshot for rbd image in Ceph(as OpenStack-Glance backend Storage) doesNOT match that of the rbd image.
0%
Description
Ceph Version: 12.2.2 Luminous Stable
Problem description:
We use ceph as the backend storage for OpenStack Glance and Nova. There are four osd pools involved in our configuration, rep_glance, ec_glance, rep_nova, ec_nova. The ec_glance and ec_nova pools are backed on HDDs and configured in Erasure-Coding mode.
The rep_glance and rep_nova are backed by SSD acting as the cache tiering layer for ec_glance and ec_nova pools respectively.
When uploading a VM image into the OpenStack-Glance backend storage(Ceph cluster), a rbd image named with the UUID of the VM image such as 8fa76be3-4ade-a897-ca86123467c87 and the snapshot for the image named 8fa76be3-4ade-a897-ca86123467c87@snap are generated.
When the Ceph/OpenStack clusters run for about a month, we find that the rbd image is unavailable when launching new VMs, with error information "no bootable disk". Moreover, for VMs that have been launch before that, the filesystems in VMs also print error information, such as "XFS metadata lost...".
We export the rbd image and the snapshot for it from the rep_glance and ec_glance pools using the "rbd export reppool/8fa76be3-4ade-a897-ca86123467c87 rep-image" and "rbd export reppool/fa76be3-4ade-a897-ca86123467c87@snap rep-image-snap" commands, and compares the MD5 checksums of them. (MD5 checksums are generated with "md5sum -b rep-image" and "md5sum -b rep-image-snap" commands) We find that, the MD5 checksums are NOT matched, and the MD5 checksum of the rbd image 8fa76be3-4ade-a897-ca86123467c87 is consistent with that recorded in OpenStack-Glance, so we infer that the rbd image is not changed.
But why the snapshot of the rbd image is changed? Is it read-only?
Thanks very much!
Files
Updated by Greg Farnum about 6 years ago
- Project changed from Ceph to rbd
- Category deleted (
openstack)
Updated by Jason Dillaman about 6 years ago
- Status changed from New to Need More Info
- Severity changed from 1 - critical to 3 - minor
Yes, snapshots are read-only so the only thing I can think of is some sort of data corruption on the OSDs. Have you run a deep scrub, are you using cache-tiering or any other non-standard deployment settings?
Updated by Mykola Golub about 6 years ago
Couldn't this be related to #21639 (snapshots was not created/deleted against data pool)? The reported version here is 12.2.2, where it is fixed, but was this version (and was used by Glance/Nova) at the moment when when the snapshot was created?
Updated by Jason Dillaman about 6 years ago
... possible, but it actually does say it's replicated cache tiers in front of EC backends which should rule-out data pools.
Updated by 宏伟 唐 about 6 years ago
Jason Dillaman wrote:
Yes, snapshots are read-only so the only thing I can think of is some sort of data corruption on the OSDs. Have you run a deep scrub, are you using cache-tiering or any other non-standard deployment settings?
In part of the OSDs, there exist the following logs:
11859: -5389> 2018-02-24 13:24:40.874052 7fe640d8ed005 asok(0x5582f3341c0) register_command dump_scrubs hook 0x5582f32e1a40
11872: -5376> 2018-02-24 13:24:40.874176 7fe640d8ed005 asok(0x5582f3341c0) register_command trigger_scrub hook 0x5582f4f5f0a0
15406: -1842> 2018-02-24 13:24:47.982268 7fe63aae9700 5 -- 10.10.102.6:6814/14234 >> 10.10.102.7:6814/45068 conn(0x5582f99c2000 : -1 s=STATE_OPEN_MESSAGE_READ_FOOTER_AND_DISPATCH pgs=7 cs=1 l=0). rx osd.104 seq 34 0x5582fc410c80 replica scrub(pg: 6.f,from:0'0,to:1010'4962,epoch:1018/1016,start:6:f000000::::head,end:6:f0c7a5b4:::rbd_object_map.1af99d39d3ae5b:0,chunky:1,deep:0,seed:4294967295,version:7) v7
15407: -1841> 2018-02-24 13:24:47.982308 7fe63aae9700 1 -- 10.10.102.6:6814/14234 << osd.104 10.10.102.7:6814/45068 34 ==== replica scrub(pg: 6.f,from:0'0,to:1010'4962,epoch:1018/1016,start:6:f000000::::head,end:6:f0c7a5b4:::rbd_object_map.1af99d39d3ae5b:0,chunky:1,deep:0,seed:4294967295,version:7) v7 ==== 163+0+0 (440793998 0 0) 0x5582fc410c80 con 0x5582f99c2000
15408: -1840> 2018-02-24 13:24:47.983541 7fe61eaf3700 1 -- 10.10.102.6:6814/14234 --> 10.10.102.7:6814/45068 -- rep_scrubmap(6.f e1018 from shard 103) v1 -- 0x5582fb66d200 con 0
Is such log information indicates errors?
Thanks!
Updated by Mykola Golub about 6 years ago
It looks like your log entries are from in memory log dump. Did you osd crash (could be seen in the log) or did you use `ceph daemon osd.X log dump`? If it crashed, showing the backtrace here might be useful.
Updated by 宏伟 唐 about 6 years ago
Mykola Golub wrote:
It looks like your log entries are from in memory log dump. Did you osd crash (could be seen in the log) or did you use `ceph daemon osd.X log dump`? If it crashed, showing the backtrace here might be useful.
The logs in #5 is from logging files (such as /var/log/ceph/ceph-osd.104.log-20180225.gz).
There are no logs indicating osd crash and the outputs of 'ceph daemon osd.x log dump' are all empty ({}).
Updated by 宏伟 唐 about 6 years ago
Jason Dillaman wrote:
Yes, snapshots are read-only so the only thing I can think of is some sort of data corruption on the OSDs. Have you run a deep scrub, are you using cache-tiering or any other non-standard deployment settings?
I exported the image (8fa76be3-4ade-a897-ca86123467c87) and the corresponding snapshot (8fa76be3-4ade-a897-ca86123467c87@snap)using the using the "rbd export reppool/8fa76be3-4ade-a897-ca86123467c87 rep-image" and "rbd export reppool/fa76be3-4ade-a897-ca86123467c87@snap rep-image-snap" commands, the speeds for downloading the image and the snapshot are significantly different. The time for downloading the snapshot is very very very short. It seams that the sizes of the image and the snapshot are different.
Updated by Jason Dillaman about 6 years ago
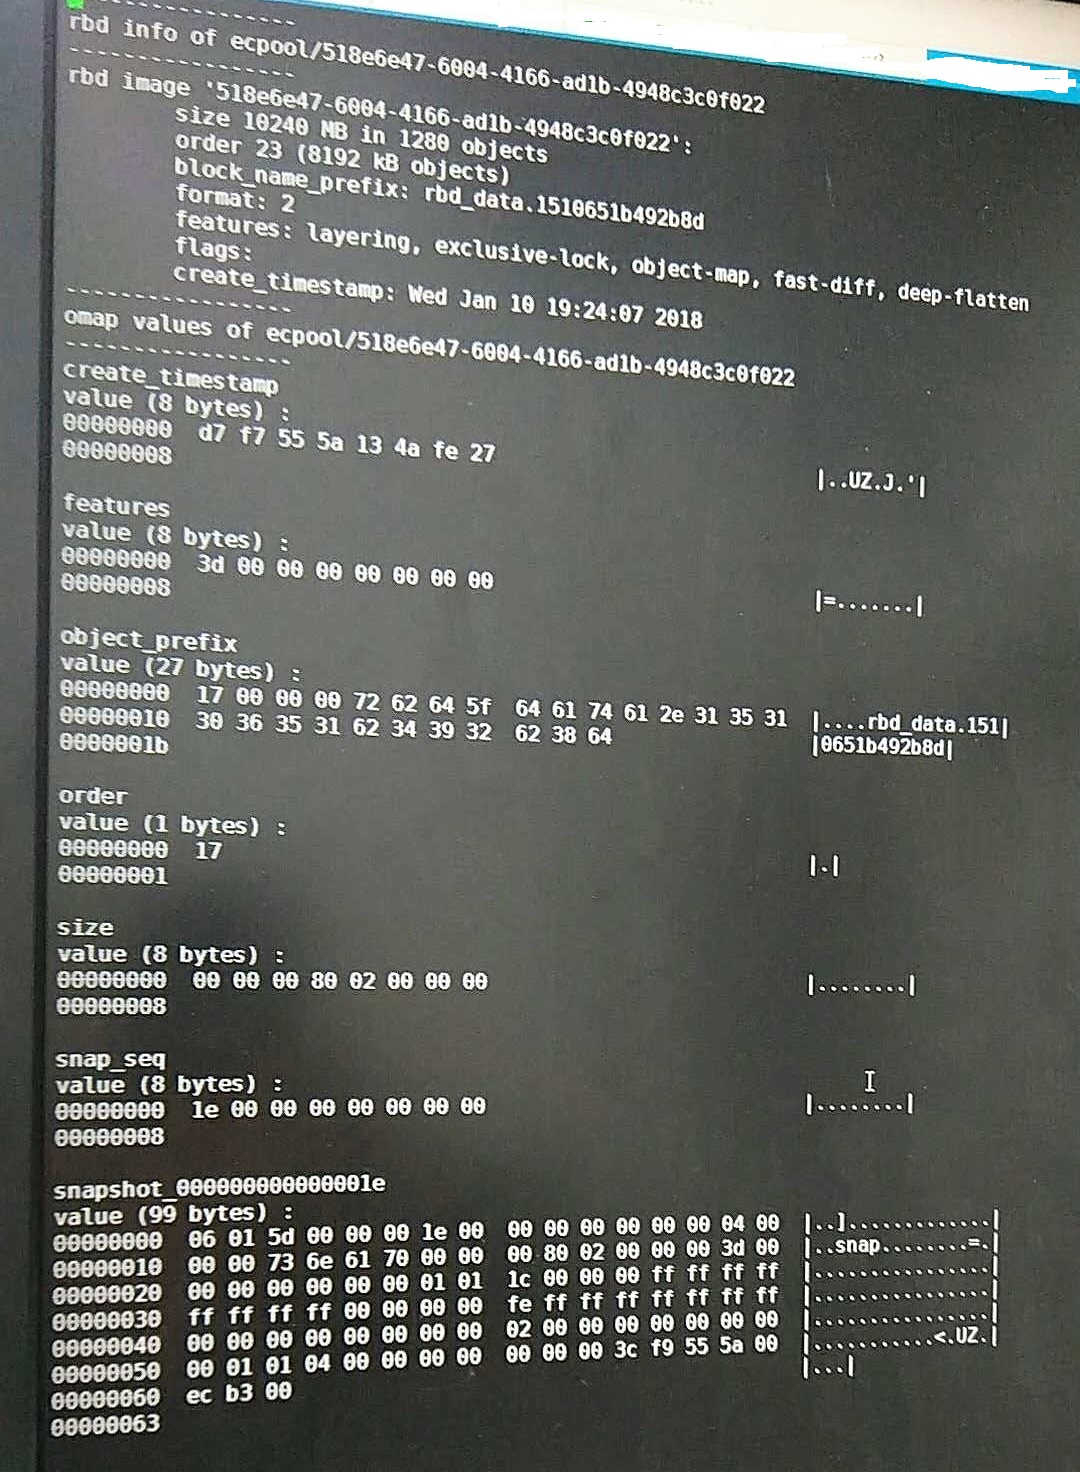
Can you please run "rados -p <pool name> listomapvals rbd_header.<image id>" and provide the output? You can determine the image id by running "rbd info <pool>/<image-name>" and using the hexadecimal suffix from the block name prefix. e.g. a block name prefix of "rbd_data.1012643c9869" implies that the image-id is "1012643c9869" so the command would be "rados -p <pool name> listomapvals rbd_header.1012643c9869".
Updated by 宏伟 唐 about 6 years ago
- File centos-bad.jpg centos-bad.jpg added
Jason Dillaman wrote:
Can you please run "rados -p <pool name> listomapvals rbd_header.<image id>" and provide the output? You can determine the image id by running "rbd info <pool>/<image-name>" and using the hexadecimal suffix from the block name prefix. e.g. a block name prefix of "rbd_data.1012643c9869" implies that the image-id is "1012643c9869" so the command would be "rados -p <pool name> listomapvals rbd_header.1012643c9869".
The attached centos-bad.jpg shows the output of the 'listomapvals' command on an image with inconsistent snapshot.
Updated by Mykola Golub about 6 years ago
There are no logs indicating osd crash and the outputs of 'ceph daemon osd.x log dump' are all empty ({}).
The messages in the log file that start with "-xyz> " (e.g. "-5389> 2018-02-24 13:24:40.874052 ..." in your case) indicate that they came from the memory log. The memory log is dumped in the file log in two cases:
1) when a user explicitly runs 'ceph daemon osd.x log dump' (the memory log is dumped to the file and the output of the command is just '{}');
2) when a daemon crashes.
If nobody ran 'log dump' command before, then your messages are from the crash, and you just need to scroll down to "0>" line to see the crash info (usually a backtrace).
Updated by Jason Dillaman about 6 years ago
Both the image HEAD and snapshot "snap" show a size of 10GB, so if your exported sizes are different, the export must be throwing an error message at some point.
Updated by 宏伟 唐 about 6 years ago
- File ceph osd crash.jpg ceph osd crash.jpg added
Mykola Golub wrote:
There are no logs indicating osd crash and the outputs of 'ceph daemon osd.x log dump' are all empty ({}).
The messages in the log file that start with "-xyz> " (e.g. "-5389> 2018-02-24 13:24:40.874052 ..." in your case) indicate that they came from the memory log. The memory log is dumped in the file log in two cases:
1) when a user explicitly runs 'ceph daemon osd.x log dump' (the memory log is dumped to the file and the output of the command is just '{}');
2) when a daemon crashes.If nobody ran 'log dump' command before, then your messages are from the crash, and you just need to scroll down to "0>" line to see the crash info (usually a backtrace).
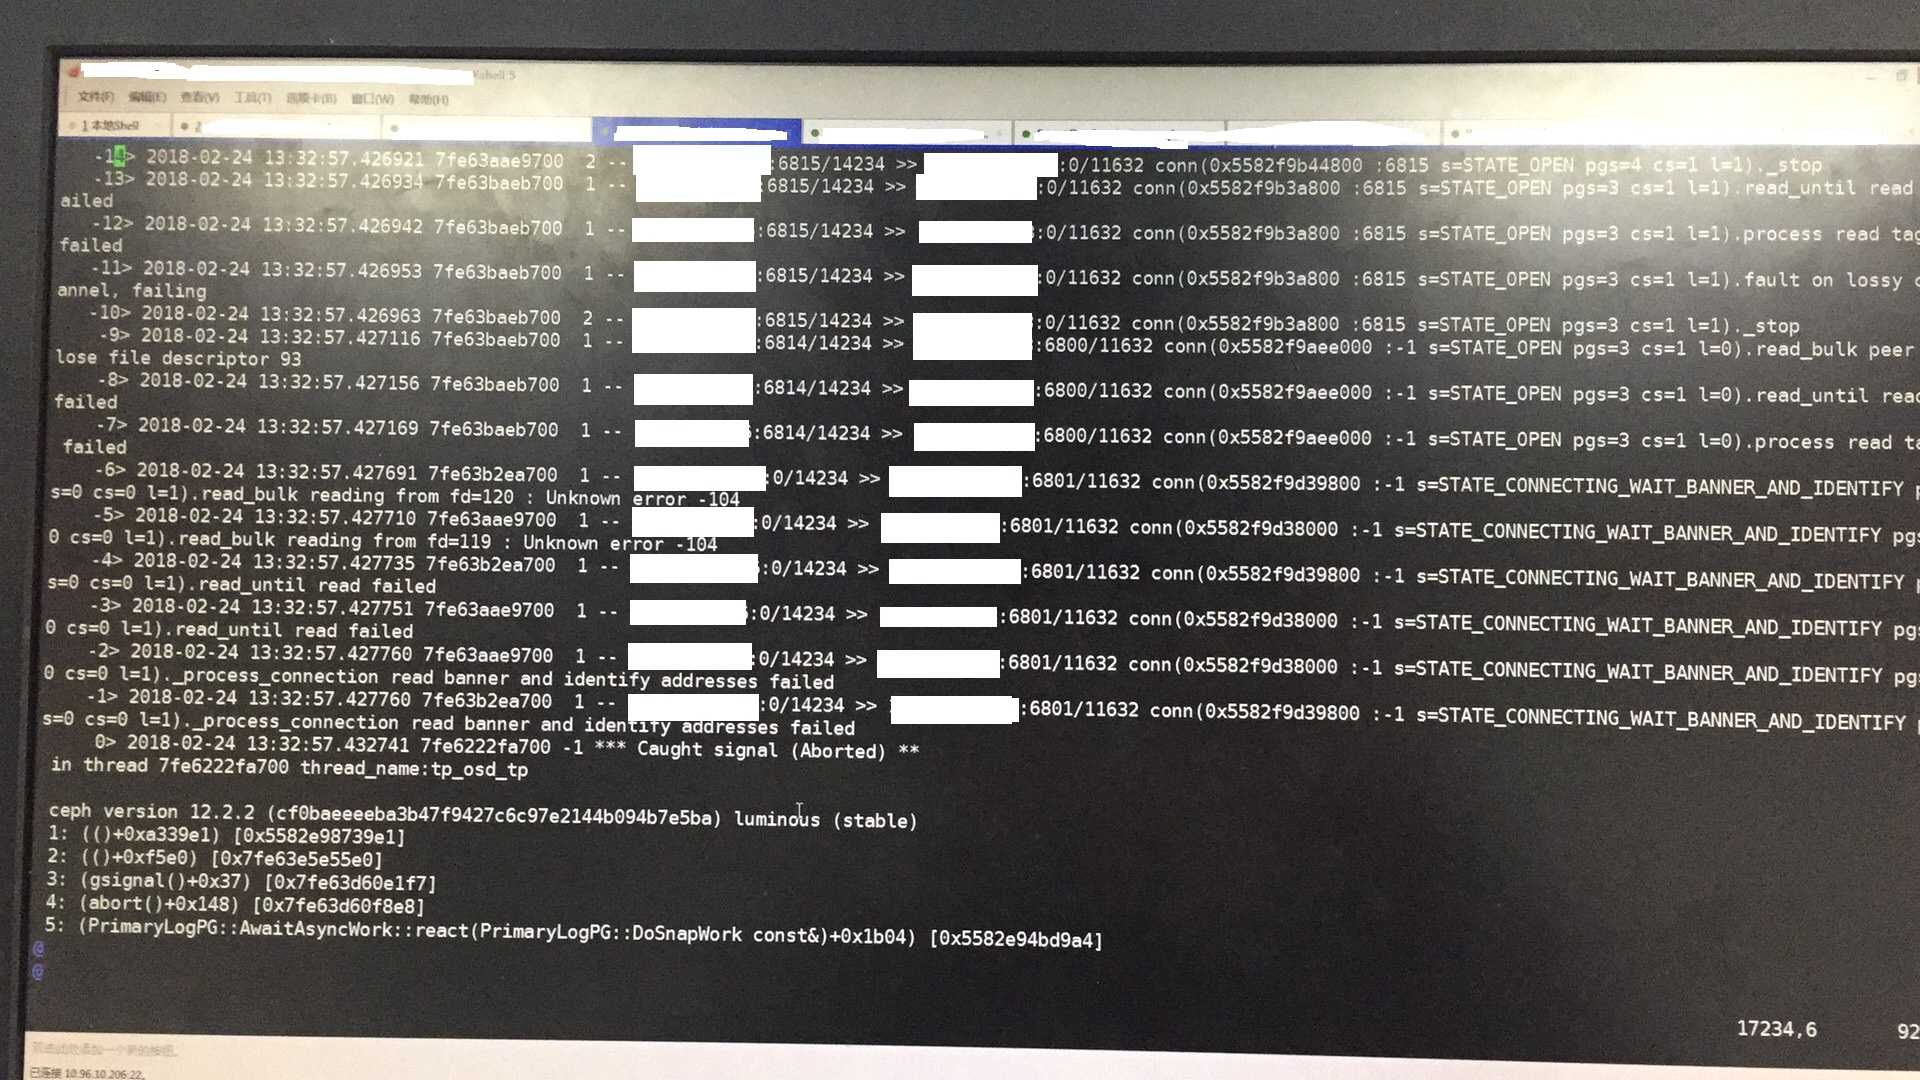
The log really shows that the osd daemon has aborted and restarted by itself.
The crashed osd daemon is for cache tiering with a SSD disk as the storage device.
The attachment shows the logs about OSD crash.
Updated by 宏伟 唐 about 6 years ago
- File osd crash call trace.jpg osd crash call trace.jpg added
宏伟 唐 wrote:
Mykola Golub wrote:
There are no logs indicating osd crash and the outputs of 'ceph daemon osd.x log dump' are all empty ({}).
The messages in the log file that start with "-xyz> " (e.g. "-5389> 2018-02-24 13:24:40.874052 ..." in your case) indicate that they came from the memory log. The memory log is dumped in the file log in two cases:
1) when a user explicitly runs 'ceph daemon osd.x log dump' (the memory log is dumped to the file and the output of the command is just '{}');
2) when a daemon crashes.If nobody ran 'log dump' command before, then your messages are from the crash, and you just need to scroll down to "0>" line to see the crash info (usually a backtrace).
The log really shows that the osd daemon has aborted and restarted by itself.
The crashed osd daemon is for cache tiering with a SSD disk as the storage device.The attachment shows the logs about OSD crash.
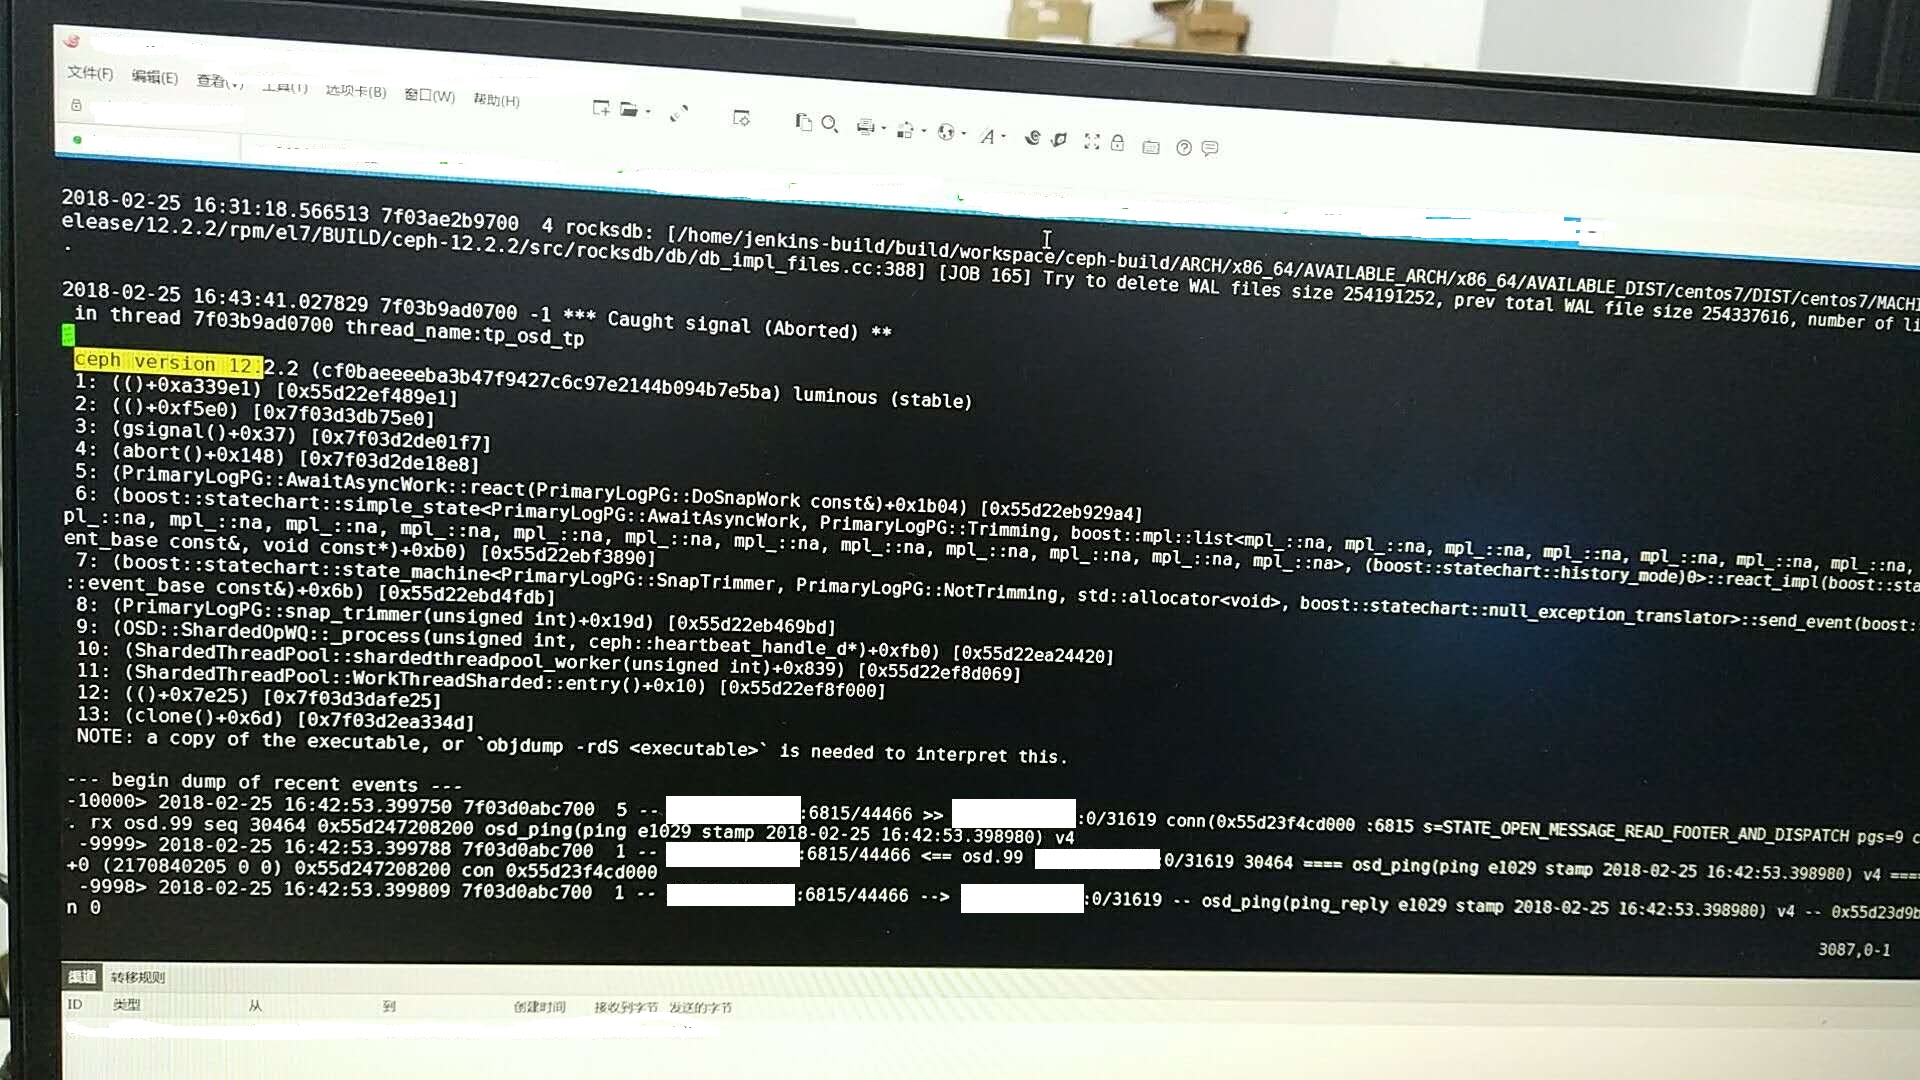
A full osd crash call trace is show in the attachment.
Updated by 宏伟 唐 about 6 years ago
宏伟 唐 wrote:
宏伟 唐 wrote:
Mykola Golub wrote:
There are no logs indicating osd crash and the outputs of 'ceph daemon osd.x log dump' are all empty ({}).
The messages in the log file that start with "-xyz> " (e.g. "-5389> 2018-02-24 13:24:40.874052 ..." in your case) indicate that they came from the memory log. The memory log is dumped in the file log in two cases:
1) when a user explicitly runs 'ceph daemon osd.x log dump' (the memory log is dumped to the file and the output of the command is just '{}');
2) when a daemon crashes.If nobody ran 'log dump' command before, then your messages are from the crash, and you just need to scroll down to "0>" line to see the crash info (usually a backtrace).
The log really shows that the osd daemon has aborted and restarted by itself.
The crashed osd daemon is for cache tiering with a SSD disk as the storage device.The attachment shows the logs about OSD crash.
A full osd crash call trace is show in the attachment.
The OSD crash is triggered by "Deleting an image in openstack-glance". When the OSD process terminates due to crash, it will restart itself immediately.
Updated by 宏伟 唐 almost 6 years ago
More discovery:
The snapshot exported from cache tier(rep_glance pool) is an all-zero file (viewed by "od xxx.snap"). I removed the cache tier (rep_glance pool) from the base storage pool (ec_pool), and exported the snapshot from the ec_glance pool. In the latter case, the snapshot is consistent with the image.
Finally, I added the cache tier (rep_glance pool) to the ec_glance base storage pool again, and exported the snapshot from the rep_glance pool again, the snapshot recovered and is consistent with the image.
Updated by Jason Dillaman almost 6 years ago
- Project changed from rbd to RADOS
Moving to RADOS since it sounds like it's an issue of corruption on your cache tier.
Updated by 宏伟 唐 almost 6 years ago
Jason Dillaman wrote:
Moving to RADOS since it sounds like it's an issue of corruption on your cache tier.
How should I do? Can you tell me the detail?
Updated by 宏伟 唐 almost 6 years ago
Jason Dillaman wrote:
Moving to RADOS since it sounds like it's an issue of corruption on your cache tier.
I removed the cache tier (SSD), and set glance directly using the storage pool (3-copy replicated pool on HDD). The bug occurred again.