Bug #22094
closedLots of reads on default.rgw.usage pool
0%
Description
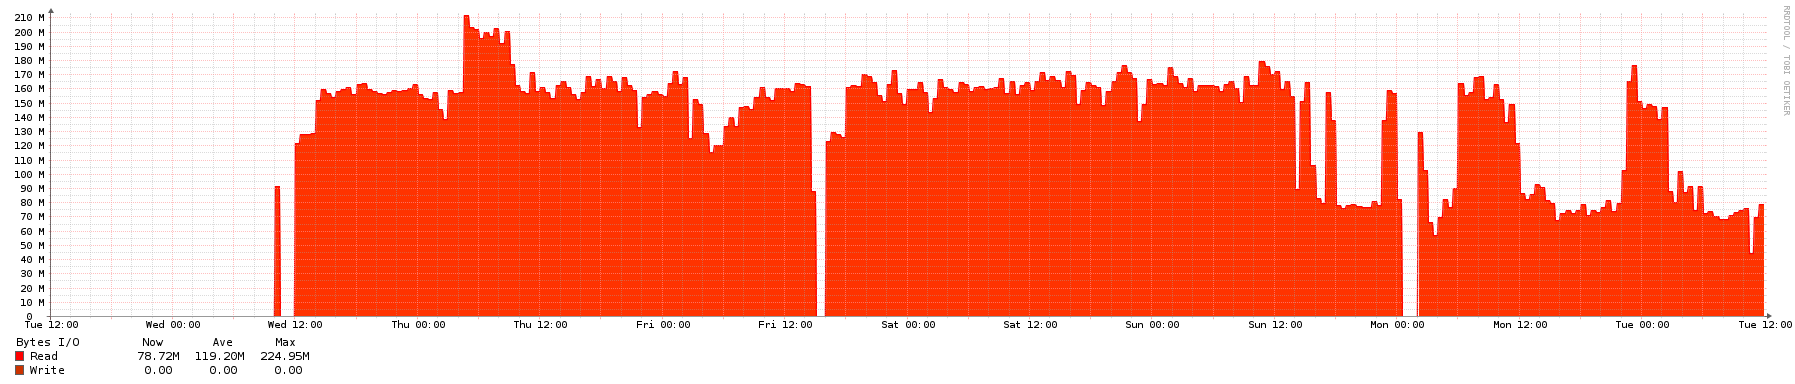
Since I upgraded to Luminous a few weeks ago, I see a lot of read-activity on the default.rgw.usage pool. (See attached image). I think it has something to with the rgw-daemons, since restarting them slows the reads down for a while. It might also have to do with tenants and the fact that dynamic bucket sharding isn't working for me (http://tracker.ceph.com/issues/22046).
Stracing the radosgw-process, I see a lot of the following:
[pid 12364] sendmsg(23, {msg_name(0)=NULL, msg_iov(5)=[{"\7{\340\r\0\0\0\0\0P\200\16\0\0\0\0\0*\0?\0\10\0\331\0\0\0\0\0\0\0M"..., 54}, {"\1\1\22\0\0\0\1\10\0\0\0\0\0\0\0\0\0\0\0\377\377\377\377\377\20\226\206\351\v3\0\0"..., 217}, {"rgwuser_usage_log_read", 22}, {"\1\0011\0\0\0\0000\320Y\0\0\0\0\200\16\371Y\0\0\0\0\25\0\0\0DB0339"..., 55}, {"\305\234\203\332\0\0\0\0K~\356z\4\266\305\272\27hTx\5", 21}], msg_controllen=0, msg_flags=0}, MSG_NOSIGNAL) = 369
I disabled the dynamic bucket sharding via 'rgw_dynamic_resharding = false', but that doesn't seem to help. Maybe bucketsharding is still trying to run because of the entry in 'radosgw-admin reshard list' that I cannot delete?
Files
Updated by Mark Schouten over 6 years ago
Is there anything I can do to debug this?
Updated by Orit Wasserman over 6 years ago
Hi,
Can you provide rgw logs with debug_rgw=20 and debug_ms=1?
Can you provide more info about your setup and config?
Updated by Yehuda Sadeh over 6 years ago
- Status changed from New to Need More Info
Updated by Mark Schouten over 6 years ago
- File ceph.conf.rtf ceph.conf.rtf added
2017-11-16 22:09:54.579970 7faa64f17700 1 -- [fdf5:c7f1:ca7b:0:10:10:9:101]:0/3705443576 <== osd.3 [fdf5:c7f1:ca7b:0:10:10:9:1]:6804/2209 137728 ==== osd_op_reply(141862 usage.12 [call] v0'0 uv153360 ondisk = 0) v8 ==== 152+0+15 (728401604 0 3090631255) 0x564f08006680 con 0x564f08057000
2017-11-16 22:09:54.580142 7faa29c9a700 1 -- [fdf5:c7f1:ca7b:0:10:10:9:101]:0/3705443576 --> [fdf5:c7f1:ca7b:0:10:10:9:1]:6804/2209 -- osd_op(unknown.0.0:141863 8.0 8:08696197:::usage.12:head [call rgw.user_usage_log_read] snapc 0=[] ondisk+read+known_if_redirected e13341) v8 -- 0x564f0a6cb0c0 con 0
2017-11-16 22:09:54.583087 7faa64f17700 1 -- [fdf5:c7f1:ca7b:0:10:10:9:101]:0/3705443576 <== osd.3 [fdf5:c7f1:ca7b:0:10:10:9:1]:6804/2209 137729 ==== osd_op_reply(141863 usage.12 [call] v0'0 uv153360 ondisk = 0) v8 ==== 152+0+15 (728401604 0 3090631255) 0x564f08006680 con 0x564f08057000
2017-11-16 22:09:54.583206 7faa29c9a700 1 -- [fdf5:c7f1:ca7b:0:10:10:9:101]:0/3705443576 --> [fdf5:c7f1:ca7b:0:10:10:9:1]:6804/2209 -- osd_op(unknown.0.0:141864 8.0 8:08696197:::usage.12:head [call rgw.user_usage_log_read] snapc 0=[] ondisk+read+known_if_redirected e13341) v8 -- 0x564f0ac749c0 con 0
2017-11-16 22:09:54.586378 7faa64f17700 1 -- [fdf5:c7f1:ca7b:0:10:10:9:101]:0/3705443576 <== osd.3 [fdf5:c7f1:ca7b:0:10:10:9:1]:6804/2209 137730 ==== osd_op_reply(141864 usage.12 [call] v0'0 uv153360 ondisk = 0) v8 ==== 152+0+15 (728401604 0 3090631255) 0x564f08006680 con 0x564f08057000
2017-11-16 22:09:54.586557 7faa29c9a700 1 -- [fdf5:c7f1:ca7b:0:10:10:9:101]:0/3705443576 --> [fdf5:c7f1:ca7b:0:10:10:9:1]:6804/2209 -- osd_op(unknown.0.0:141865 8.0 8:08696197:::usage.12:head [call rgw.user_usage_log_read] snapc 0=[] ondisk+read+known_if_redirected e13341) v8 -- 0x564f094dc340 con 0
2017-11-16 22:09:54.589593 7faa64f17700 1 -- [fdf5:c7f1:ca7b:0:10:10:9:101]:0/3705443576 <== osd.3 [fdf5:c7f1:ca7b:0:10:10:9:1]:6804/2209 137731 ==== osd_op_reply(141865 usage.12 [call] v0'0 uv153360 ondisk = 0) v8 ==== 152+0+15 (728401604 0 3090631255) 0x564f08006680 con 0x564f08057000
2017-11-16 22:09:54.589737 7faa29c9a700 1 -- [fdf5:c7f1:ca7b:0:10:10:9:101]:0/3705443576 --> [fdf5:c7f1:ca7b:0:10:10:9:1]:6804/2209 -- osd_op(unknown.0.0:141866 8.0 8:08696197:::usage.12:head [call rgw.user_usage_log_read] snapc 0=[] ondisk+read+known_if_redirected e13341) v8 -- 0x564f0a6d63c0 con 0
2017-11-16 22:09:54.592782 7faa64f17700 1 -- [fdf5:c7f1:ca7b:0:10:10:9:101]:0/3705443576 <== osd.3 [fdf5:c7f1:ca7b:0:10:10:9:1]:6804/2209 137732 ==== osd_op_reply(141866 usage.12 [call] v0'0 uv153360 ondisk = 0) v8 ==== 152+0+15 (728401604 0 3090631255) 0x564f08006680 con 0x564f08057000
These logmessages seem to be related.
Setup is:
Four OSD-nodes (VM's with 4x 8TB or 6TB)
Three of them are monitors
Two RGW nodes (VM's)
Nothing really fancy.
Most RGW users are tenant-users. There are also RBD clients.
See ceph.conf attached
Updated by Yehuda Sadeh over 6 years ago
maybe an issue with the is_truncated check when reading the usage?
Updated by Abhishek Lekshmanan over 6 years ago
the usage log isn't read by RGWs themselves (as per my understanding so far, I could be wrong) are there tools using radosgw-admin usage show (or the non standard S3 API get usage?), commonly collectd/prometheus/ceilometer plugins poll by reading these stats, are there any such tools which are operating on the cluster?
Updated by Mark Schouten over 6 years ago
For invoicing purposes, I use the following calls:
- /$rgw_admin_entry/user
- /$rgw_admin_entry/metadata/user
- /$rgw_admin_entry/usage {'uid':self.uid, 'show-summary': True, 'start': now['fromdate'], 'end': now['todate'], 'show-entries': False}
- /$rgw_admin_entry/bucket {uid=self.uid, stats=True}
Updated by Mark Schouten over 6 years ago
2017-11-20 17:04:09.146690 7fd5d8968700 20 QUERY_STRING=format=json&show-summary=True&start=2017-11-01&show-entries=False&end=2017-12-01&uid=XYZ%24ABC
2017-11-20 17:04:09.146699 7fd5d8968700 20 REQUEST_METHOD=GET
2017-11-20 17:04:09.146700 7fd5d8968700 20 REQUEST_URI=/$rgw_admin_entry/usage
2017-11-20 17:04:09.146700 7fd5d8968700 20 SCRIPT_URI=/$rgw_admin_entry/usage
This seems to be the cause. After this call, it ends up looping with call rgw.user_usage_log_read..
The bucket at hand is the one causing the issues in http://tracker.ceph.com/issues/22046.
Updated by Vaibhav Bhembre over 6 years ago
I am not sure if my problem is related but my "radosgw-admin usage show" calls do not return. They just hang on the following loop:
2017-11-20 22:25:31.524999 7fdd6d14f700 10 client.723664.objecter ms_dispatch 0x5643435cf9f0 osd_op_reply(291 usage.29 [call] v0'0 uv489002 ondisk = 0) v8
2017-11-20 22:25:31.525008 7fdd6d14f700 10 client.723664.objecter in handle_osd_op_reply
2017-11-20 22:25:31.525010 7fdd6d14f700  7 client.723664.objecter handle_osd_op_reply 291 ondisk uv 489002 in 74.0 attempt 0
2017-11-20 22:25:31.525012 7fdd6d14f700 10 client.723664.objecter  op 0 rval 0 len 15
2017-11-20 22:25:31.525013 7fdd6d14f700 15 client.723664.objecter handle_osd_op_reply completed tid 291
2017-11-20 22:25:31.525014 7fdd6d14f700 15 client.723664.objecter finish_op 291
2017-11-20 22:25:31.525016 7fdd6d14f700 20 client.723664.objecter put_session s=0x564343756fb0 osd=3 4
2017-11-20 22:25:31.525017 7fdd6d14f700 15 client.723664.objecter _session_op_remove 3 291
2017-11-20 22:25:31.525019 7fdd6d14f700  5 client.723664.objecter 0 in flight
2017-11-20 22:25:31.525023 7fdd6d14f700 20 client.723664.objecter put_session s=0x564343756fb0 osd=3 3
2017-11-20 22:25:31.525072 7fdd7e9beb80 10 client.723664.objecter _op_submit op 0x564343731710
2017-11-20 22:25:31.525076 7fdd7e9beb80 20 client.723664.objecter _calc_target epoch 17682 base usage.29 @74 precalc_pgid 0 pgid 0.0 is_read
2017-11-20 22:25:31.525079 7fdd7e9beb80 20 client.723664.objecter _calc_target target usage.29 @74 -> pgid 74.f6822e40
2017-11-20 22:25:31.525089 7fdd7e9beb80 10 client.723664.objecter _calc_target  raw pgid 74.f6822e40 -> actual 74.0 acting [3,16,9] primary 3
2017-11-20 22:25:31.525108 7fdd7e9beb80 20 client.723664.objecter _get_session s=0x564343756fb0 osd=3 3
2017-11-20 22:25:31.525112 7fdd7e9beb80 10 client.723664.objecter _op_submit oid usage.29 '@74' '@74' [call rgw.user_usage_log_read] tid 292 osd.3
2017-11-20 22:25:31.525115 7fdd7e9beb80 20 client.723664.objecter get_session s=0x564343756fb0 osd=3 3
2017-11-20 22:25:31.525116 7fdd7e9beb80 15 client.723664.objecter _session_op_assign 3 292
2017-11-20 22:25:31.525118 7fdd7e9beb80 15 client.723664.objecter _send_op 292 to 74.0 on osd.3
2017-11-20 22:25:31.525126 7fdd7e9beb80 20 client.723664.objecter put_session s=0x564343756fb0 osd=3 4
2017-11-20 22:25:31.525128 7fdd7e9beb80  5 client.723664.objecter 1 in flight
The "tid" keeps on increasing but the call never returns. I don't see any errors or issues when I bump up the log levels on OSD either. This was not an issue before the upgrade to Luminous 12.2.0, that occurred this week.
If my problem is not related, I will make a new ticket.
Updated by Abhishek Lekshmanan over 6 years ago
Can you also give us the output of radosgw-admin usage show --debug-rgw=20 --debug-ms=1 (this is verbose)
Updated by Vaibhav Bhembre over 6 years ago
Certainly. Please see the output of that command here: https://hastebin.com/raw/omoqetimun. Let me know if there's anything else I can provide.
Updated by Mark Schouten over 6 years ago
- File broken.log.gz broken.log.gz added
- File works.log.gz works.log.gz added
See two logs. One of the users (from broken.log) needs a run from dynamic bucket sharding.
Updated by Vaibhav Bhembre over 6 years ago
BTW just wanted to note here, that as a workaround we can bump the value of "osd_max_omap_entries_per_request" (a new Luminous-based config option) on all OSDs that store objects of usage pool to a sufficiently high value (and not too high of course) in order to avoid truncating output of OMAP values. That should help prevent this infinite loop as a temporary workaround until the fix goes out into the next patch release.
Updated by Mark Schouten over 6 years ago
Can you clarify this? I now restart my rgw daemons every hour, which is ... ehm ... Suboptimal. :)
Updated by Abhishek Lekshmanan over 6 years ago
I assume there are a lot of entries in usage pool which might explain the slowdown, can you try doing something in the lines of
$ rados -p default.rgw.usage ls > objs.out list of objects
$ for i in `cat objs.out`; do rados -p default.rgw.usage listomapkeys $i | wc -l; done and see how many omap values we have
if we have millions of keys, purging older logs may be the way to go, given that they are already backed up in some sort of database like your collectd;
Updated by Mark Schouten over 6 years ago
root@osdnode01:~# rados -p default.rgw.usage ls > objs.out
root@osdnode01:~# for i in `cat objs.out`; do rados -p default.rgw.usage listomapkeys $i | wc -l; done
4666
3162
6
718
920
1550
1636
3572
190
8
2240
1154
1164
1082
6
6
2930
992
3414
2460
80
360
38078
Updated by Vaibhav Bhembre over 6 years ago
12.2.2 solves it permanently, especially this change: https://github.com/ceph/ceph/pull/17939.
Truncation logic was broken when query would hit >1000 omap entries for usage shards. This was sending reads into infinite loop because the flag would never become false after that point. The 1000 number comes from hard-coded constants here: https://github.com/ceph/ceph/blob/v12.2.1/src/rgw/rgw_op.cc#L1902 and here: https://github.com/ceph/ceph/blob/v12.2.1/src/rgw/rgw_usage.cc#L38. Since the value for omap entry pagination is applied only at 131K, it'd never be hit since the hard-coded constants kick in a lot before it does.
Updated by Abhishek Lekshmanan over 6 years ago
Thanks for confirmation, good to hear that
Updated by Mark Schouten over 6 years ago
Yes, after upgrading to 12.2.2, I haven't seen this behaviour anymore.
Updated by Orit Wasserman over 6 years ago
- Status changed from Need More Info to Closed