Bug #18994
closedHigh CPU usage for ceph-mgr daemon v11.2.0
0%
Description
Hello,
We are facing high CPU usage which is consumed by ceph-mgr process.
Environment:-
RHEL7.2
kraken - v11.2.0 - bluestore
5 Node, EC 4+1 24/68 disk per node
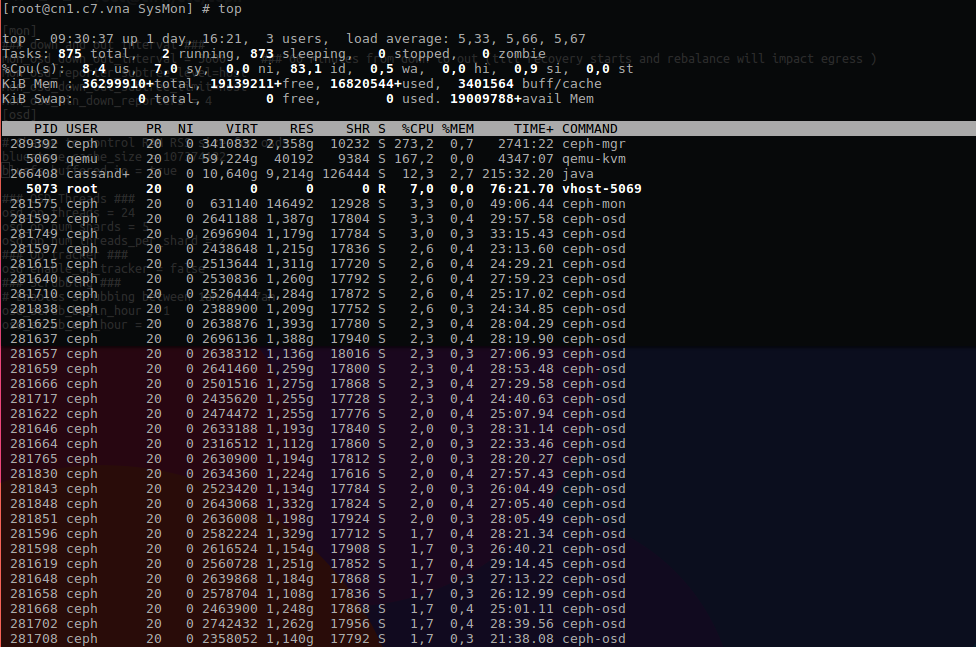
You can refer the "htop command" attachment, ceph-mgr daemon is using near 3 CPUs.
As a workaround we stopped this ceph-mgr service for now.
Files
Updated by Muthusamy Muthiah about 7 years ago
Due to high CPU utilisation we stopped the ceph-mgr on all our cluster.
On one of our cluster we saw high memory usage by OSDs some grater than 5GB causing OOM , resulting in process kill.
The memory was released immediately when the ceph-mgr started . So, this issue is clearly a side effect of stopping the ceph-mgr process . What we dont understand is why all OSDs are reporting a single OSD issue and locking so much of memory until ceph-mgr is started ?
1. Ceph status higliting there is issue on one of the OSD in 5th node "wrong node":
cn1.vn1ldv1c1.cdn ~# ceph status
2017-03-28 05:54:52.210450 7f8108a84700 1 WARNING: the following dangerous and experimental features are enabled: bluestore,rocksdb 10.139.4.81:0/2856869581 >> 10.139.4.85:6800/44958 conn(0x7f80e8002bc0 :-1 s=STATE_CONNECTING_WAIT_BANNER_AND_IDENTIFY pgs=0 cs=0 l=1)._process_connection connect claims to be 10.139.4.85:6800/273761 not 10.139.4.85:6800/44958 - wrong node!
2017-03-28 05:54:52.231551 7f8108a84700 -1 WARNING: the following dangerous and experimental features are enabled: bluestore,rocksdb
2017-03-28 05:54:52.400565 7f8101ac6700 0 -
cluster 71a32568-96f3-4998-89dd-e2e7d77a6824
health HEALTH_OK
monmap e3: 5 mons at {cn1=10.139.4.81:6789/0,cn2=10.139.4.82:6789/0,cn3=10.139.4.83:6789/0,cn4=10.139.4.84:6789/0,cn5=10.139.4.85:6789/0}
election epoch 24, quorum 0,1,2,3,4 cn1,cn2,cn3,cn4,cn5
mgr active: cn5
osdmap e2010: 335 osds: 335 up, 335 in
flags sortbitwise,require_jewel_osds,require_kraken_osds
pgmap v561117: 8192 pgs, 1 pools, 28323 GB data, 12400 kobjects
37667 GB used, 1182 TB / 1218 TB avail
8192 active+clean
client io 31732 kB/s rd, 57763 kB/s wr, 59 op/s rd, 479 op/s wr
2. numastat of ceph shows that it has consumed total of 275GB memory and most of them consuming more than 5GB.
cn1.vn1ldv1c1.cdn /var/log/cassandra# numastat -s cephPer-node process memory usage (in MBs)
PID Node 0 Node 1 Total
----------------- --------------- --------------- ---------------
372602 (ceph-osd) 5418.34 2.84 5421.18
491602 (ceph-osd) 5351.95 2.83 5354.78
417717 (ceph-osd) 5175.98 2.83 5178.81
273980 (ceph-osd) 5167.83 2.82 5170.65
311956 (ceph-osd) 5167.04 2.84 5169.88
440537 (ceph-osd) 5161.57 2.84 5164.41
368422 (ceph-osd) 5157.87 2.83 5160.70
292227 (ceph-osd) 5156.42 2.83 5159.25
360749 (ceph-osd) 5129.43 2.83 5132.26
516040 (ceph-osd) 5112.53 2.84 5115.37
526274 (ceph-osd) 5108.76 2.83 5111.59
300197 (ceph-osd) 5096.64 2.82 5099.46
487087 (ceph-osd) 5081.70 2.82 5084.52
396562 (ceph-osd) 5060.55 2.84 5063.38
409201 (ceph-osd) 5058.06 2.83 5060.89
284767 (ceph-osd) 5027.94 2.82 5030.76
520653 (ceph-osd) 4997.16 2.82 4999.98
302873 (ceph-osd) 4988.78 2.82 4991.60
364601 (ceph-osd) 4884.61 2.83 4887.43
426998 (ceph-osd) 4865.89 2.82 4868.72
294856 (ceph-osd) 4851.96 2.82 4854.78
306064 (ceph-osd) 4780.84 2.85 4783.68
449676 (ceph-osd) 4764.82 2.84 4767.66
376469 (ceph-osd) 4750.47 2.82 4753.29
482502 (ceph-osd) 4729.85 2.84 4732.69
357126 (ceph-osd) 4706.88 2.82 4709.71
346001 (ceph-osd) 4693.43 2.84 4696.27
511640 (ceph-osd) 4668.58 2.82 4671.41
282682 (ceph-osd) 4614.66 2.84 4617.50
287330 (ceph-osd) 4613.75 2.82 4616.57
506197 (ceph-osd) 4604.59 2.84 4607.43
332253 (ceph-osd) 4587.28 2.82 4590.11
413603 (ceph-osd) 4579.29 2.84 4582.12
297473 (ceph-osd) 4569.20 2.84 4572.04
431396 (ceph-osd) 4537.83 2.84 4540.66
501424 (ceph-osd) 4533.19 2.84 4536.03
477729 (ceph-osd) 4505.37 2.83 4508.20
392520 (ceph-osd) 4439.75 2.84 4442.59
280349 (ceph-osd) 4389.06 2.82 4391.88
321805 (ceph-osd) 4385.80 2.82 4388.62
463759 (ceph-osd) 4369.09 2.82 4371.91
328971 (ceph-osd) 4349.35 2.82 4352.18
530916 (ceph-osd) 4330.21 2.82 4333.03
468626 (ceph-osd) 4272.68 2.83 4275.51
353261 (ceph-osd) 4266.01 2.82 4268.83
339729 (ceph-osd) 4194.93 2.82 4197.75
422844 (ceph-osd) 4157.31 2.82 4160.14
400631 (ceph-osd) 4155.34 2.82 4158.16
325467 (ceph-osd) 4144.66 2.84 4147.50
380309 (ceph-osd) 4119.42 2.82 4122.24
454764 (ceph-osd) 4007.09 2.82 4009.92
336089 (ceph-osd) 4003.25 2.82 4006.07
349613 (ceph-osd) 3953.32 2.84 3956.15
473107 (ceph-osd) 3833.75 2.83 3836.59
388421 (ceph-osd) 3776.79 2.83 3779.62
308957 (ceph-osd) 3758.94 2.82 3761.76
315430 (ceph-osd) 3677.42 2.82 3680.24
445064 (ceph-osd) 3669.27 2.82 3672.09
977162 (ceph-osd) 1508.02 3.40 1511.43
166155 (ceph-osd) 1411.64 3.42 1415.06
228123 (ceph-osd) 1399.20 3.41 1402.60
39367 (ceph-osd) 1397.44 3.41 1400.85
228124 (ceph-osd) 1227.50 3.41 1230.91
284384 (ceph-osd) 1204.96 3.41 1208.37
339890 (ceph-osd) 1139.69 3.41 1143.10
467652 (ceph-osd) 1016.18 3.41 1019.59
597584 (ceph-osd) 901.18 3.41 904.58
934986 (ceph-mon) 0.02 184.65 184.67
----------------- --------------- --------------- ---------------
Total 278720.27 379.42 279099.69
3. OOM tries to kill the ceph-osd process
Mar 27 01:57:05 cn1 kernel: ceph-osd invoked oom-killer: gfp_mask=0x280da, order=0, oom_score_adj=0
Mar 27 01:57:05 cn1 kernel: ceph-osd cpuset=/ mems_allowed=0-1
Mar 27 01:57:05 cn1 kernel: CPU: 0 PID: 422861 Comm: ceph-osd Not tainted 3.10.0-327.el7.x86_64 #1
Mar 27 01:57:05 cn1 kernel: Hardware name: HP ProLiant XL450 Gen9 Server/ProLiant XL450 Gen9 Server, BIOS U21 09/12/2016
Mar 27 01:57:05 cn1 kernel: ffff884546751700 00000000275e2e50 ffff88454137b6f0 ffffffff816351f1
Mar 27 01:57:05 cn1 kernel: ffff88454137b780 ffffffff81630191 000000000487ffff ffff8846f0665590
Mar 27 01:57:05 cn1 kernel: ffff8845411b3ad8 ffff88454137b7d0 ffffffffffffffd5 0000000000000001
Mar 27 01:57:05 cn1 kernel: Call Trace:
Mar 27 01:57:05 cn1 kernel: [<ffffffff816351f1>] dump_stack+0x19/0x1b
Mar 27 01:57:05 cn1 kernel: [<ffffffff81630191>] dump_header+0x8e/0x214
Mar 27 01:57:05 cn1 kernel: [<ffffffff8116cdee>] oom_kill_process+0x24e/0x3b0
Mar 27 01:57:05 cn1 kernel: [<ffffffff8116c956>] ? find_lock_task_mm+0x56/0xc0
Mar 27 01:57:05 cn1 kernel: [<ffffffff8116d616>] out_of_memory+0x4b6/0x4f0
Mar 27 01:57:05 cn1 kernel: [<ffffffff811737f5>] __alloc_pages_nodemask+0xa95/0xb90
Mar 27 01:57:05 cn1 kernel: [<ffffffff811b78ca>] alloc_pages_vma+0x9a/0x140
Mar 27 01:57:05 cn1 kernel: [<ffffffff81197655>] handle_mm_fault+0xb85/0xf50
Mar 27 01:57:05 cn1 kernel: [<ffffffffa04f5b22>] ? xfs_perag_get_tag+0x42/0xe0 [xfs]
Mar 27 01:57:05 cn1 kernel: [<ffffffff81640e22>] __do_page_fault+0x152/0x420
Mar 27 01:57:05 cn1 kernel: [<ffffffff81641113>] do_page_fault+0x23/0x80
Mar 27 01:57:05 cn1 kernel: [<ffffffff8163d408>] page_fault+0x28/0x30
Mar 27 01:57:05 cn1 kernel: [<ffffffff813000c9>] ? copy_user_enhanced_fast_string+0x9/0x20
Mar 27 01:57:05 cn1 kernel: [<ffffffff8130600a>] ? memcpy_toiovec+0x4a/0x90
Mar 27 01:57:05 cn1 kernel: [<ffffffff8151f91f>] skb_copy_datagram_iovec+0x12f/0x2a0
Mar 27 01:57:05 cn1 kernel: [<ffffffff81574418>] tcp_recvmsg+0x248/0xbc0
Mar 27 01:57:05 cn1 kernel: [<ffffffff810bb685>] ? sched_clock_cpu+0x85/0xc0
Mar 27 01:57:05 cn1 kernel: [<ffffffff815a10eb>] inet_recvmsg+0x7b/0xa0
Mar 27 01:57:05 cn1 kernel: [<ffffffff8150ffb6>] sock_aio_read.part.7+0x146/0x160
Mar 27 01:57:05 cn1 kernel: [<ffffffff8150fff1>] sock_aio_read+0x21/0x30
Mar 27 01:57:05 cn1 kernel: [<ffffffff811ddcdd>] do_sync_read+0x8d/0xd0
Mar 27 01:57:05 cn1 kernel: [<ffffffff811de4e5>] vfs_read+0x145/0x170
Mar 27 01:57:05 cn1 kernel: [<ffffffff811def8f>] SyS_read+0x7f/0xe0
Mar 27 01:57:05 cn1 kernel: [<ffffffff81645909>] system_call_fastpath+0x16/0x1b
Mar 27 01:57:05 cn1 kernel: Mem-Info:
Mar 27 01:57:05 cn1 kernel: Node 0 DMA per-cpu:
4. On all OSDs below error flooded
2017-03-28 12:51:28.889658 7f82dd053700 0 -- 10.139.4.83:6850/121122 >> 10.139.4.85:6800/44958 conn(0x7f82eeeea000 :-1 s=STATE_CONNECTING_WAIT_BANNER_AND_IDENTIFY pgs=1164657 cs=2 l=0)._process_connection connect claims to be 10.139.4.85:6800/273761 not 10.139.4.85:6800/44958 - wrong node!
on affected osd logs,
2017-03-28 12:51:29.191346 7f8a775b6700 0 -- 10.139.4.85:6800/273761 >> - conn(0x7f8aad6c0000 :6800 s=STATE_ACCEPTING_WAIT_BANNER_ADDR pgs=0 cs=0 l=0).fault with nothing to send and in the half accept state just closed
2017-03-28 12:51:29.249841 7f8a775b6700 0 -- 10.139.4.85:6800/273761 >> - conn(0x7f8aacc34800 :6800 s=STATE_ACCEPTING_WAIT_BANNER_ADDR pgs=0 cs=0 l=0).fault with nothing to send and in the half accept state just closed
5. Once ceph-mgr started on the affected OSD node, all OSDs move to reconnect state.
2017-03-28 12:52:37.468455 7f8a77db7700 0 -- 10.139.4.85:6800/273761 >> 10.139.4.85:6928/185705 conn(0x7f8aacc34800 :-1 s=STATE_OPEN pgs=32 cs=1 l=0).*fault initiating reconnect*
2017-03-28 12:52:37.468502 7f2bbcd5b700 0 -- 10.139.4.85:6897/154091 >> 10.139.4.85:6928/185705 conn(0x7f2c63448800 :-1 s=STATE_OPEN pgs=301 cs=1 l=0).fault initiating reconnect
2017-03-28 12:52:37.469503 7fd36f161700 0 -- 10.139.4.84:6822/95096 >> 10.139.4.85:6928/185705 conn(0x7fd412f69800 :-1 s=STATE_OPEN pgs=173 cs=1 l=0).*fault initiating reconnect*
2017-03-28 12:52:37.463913 7f82dd053700 0 -- 10.139.4.83:6850/121122 >> 10.139.4.85:6928/185705 conn(0x7f83da64b800 :-1 s=STATE_OPEN pgs=154 cs=1 l=0).*fault initiating reconnect*
2017-03-28 12:52:37.468406 7fea1fc05700 0 -- 10.139.4.82:6816/97331 >> 10.139.4.85:6928/185705 conn(0x7feab70f6000 :-1 s=STATE_OPEN pgs=108 cs=1 l=0).*fault initiating reconnect*
6. Suddenly the memory decreased from 275GB to 147GB.
So, what is the impact ceph-mgr creating here ?
Updated by John Spray over 6 years ago
- Status changed from New to Need More Info
Muthusamy are you still having this issue with the 12.x code?
Updated by Nokia ceph-users over 6 years ago
Hello John,
We need to test v12.2.0 and will let you know the impact of mgr.
Thanks
Jayaram
Updated by Kees Hoekzema over 6 years ago
I'm seeing the same in a recently upgraded 11.2.1 cluster.
top:
3151 ceph 20 0 2153644 1,469g 16992 S 266,7 9,4 10365:40 ceph-mgr
numastat:
Per-node process memory usage (in MBs)
PID Node 0 Total
---------------- --------------- ---------------
3151 (ceph-mgr) 1505.28 1505.28
2266 (ceph-mon) 210.60 210.60
$ ceph -v
ceph version 11.2.1 (e0354f9d3b1eea1d75a7dd487ba8098311be38a7)
Updated by John Spray over 6 years ago
- Status changed from Need More Info to Closed
Closing this because Kraken is retired now that Luminous is out.
Please open a fresh ticket if having this issue with >= 12.2.0 code.