Bug #39955
closedAfter upgrade to Nautilus 14.2.1 mon DB is growing too fast when state of cluster is not active+clean
0%
Description
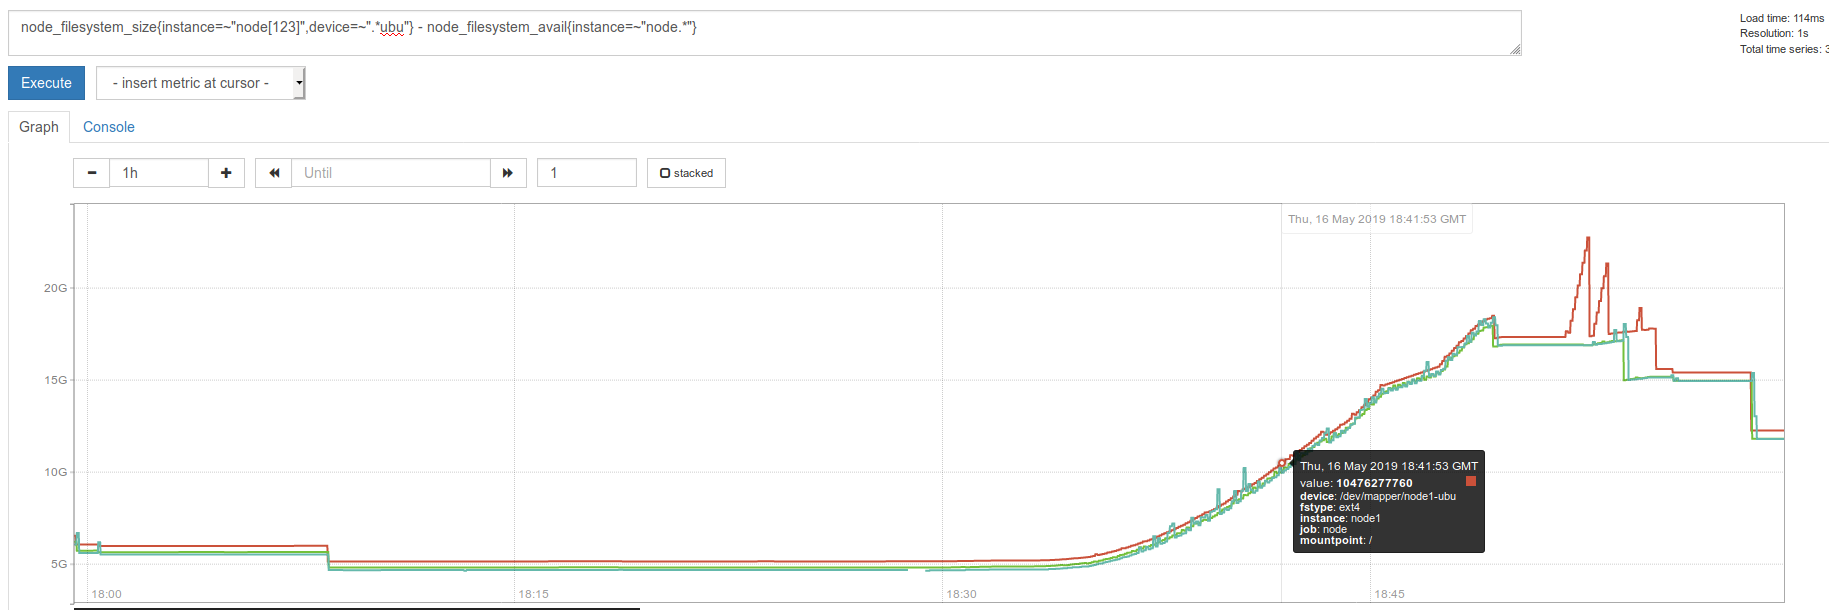
I did not track before, but after upgrade, any non-"active+clean" state lead to rapid growth of monitor DB. For example in one hour it grew to 20 GB. and in normal state is is kus 40 MB.
FS usage graph is attached
Files
Updated by Марк Коренберг almost 5 years ago
red triangular spikes -- `ceph mon compact`
Updated by Greg Farnum almost 5 years ago
- Project changed from Ceph to RADOS
- Component(RADOS) Monitor added
Updated by Neha Ojha almost 5 years ago
- Priority changed from Normal to Immediate
Updated by Neha Ojha almost 5 years ago
Are you still seeing this issue? Can you tell us what exactly was happening, when you saw non-"active+clean" state, in this example after 18:30? The output of ceph status will be useful. I do see that after compaction(red spikes), the usage goes down, does it come back to normal?
Updated by Марк Коренберг almost 5 years ago
1. Yes, I still seeing this issue. It can be triggered by rebooting a node.
2. I just rebooted my node after upgrading (you can see diconnected blue line since no meterics were collected during reboot)
3. No, compaction just do it's work correctly. Problem not in RocksDB, but in extra content in it.
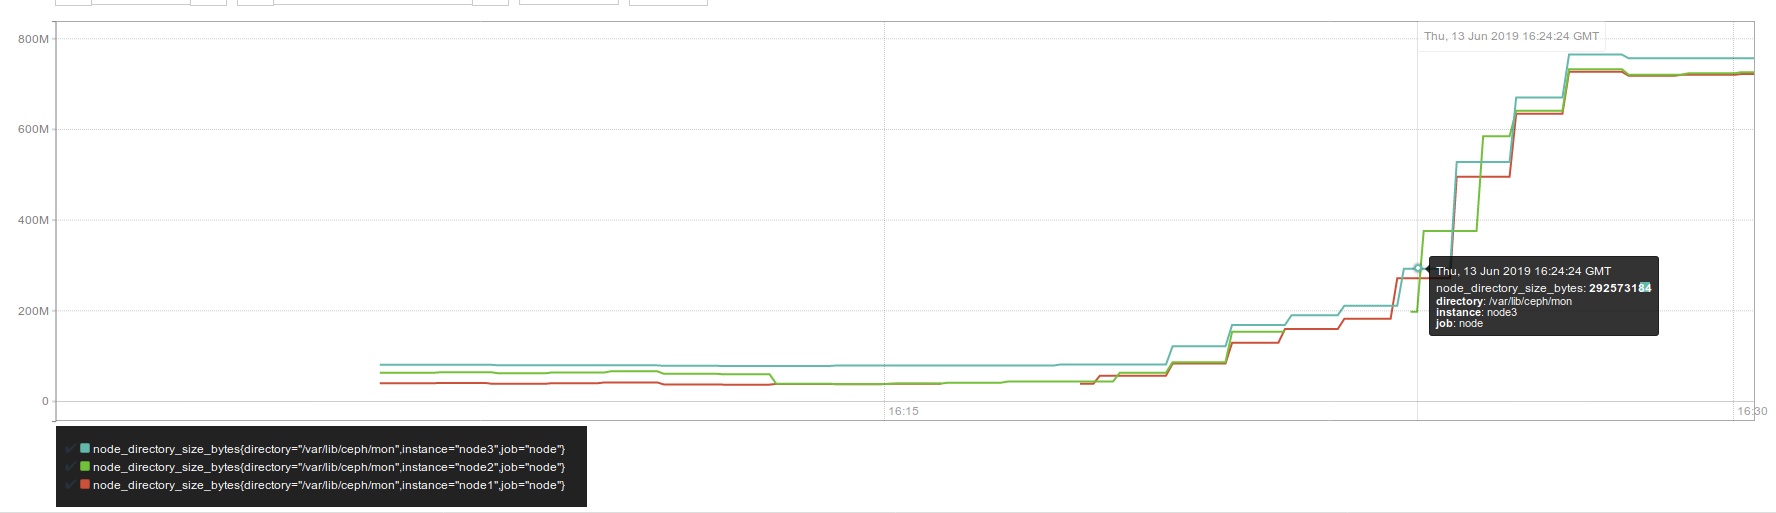
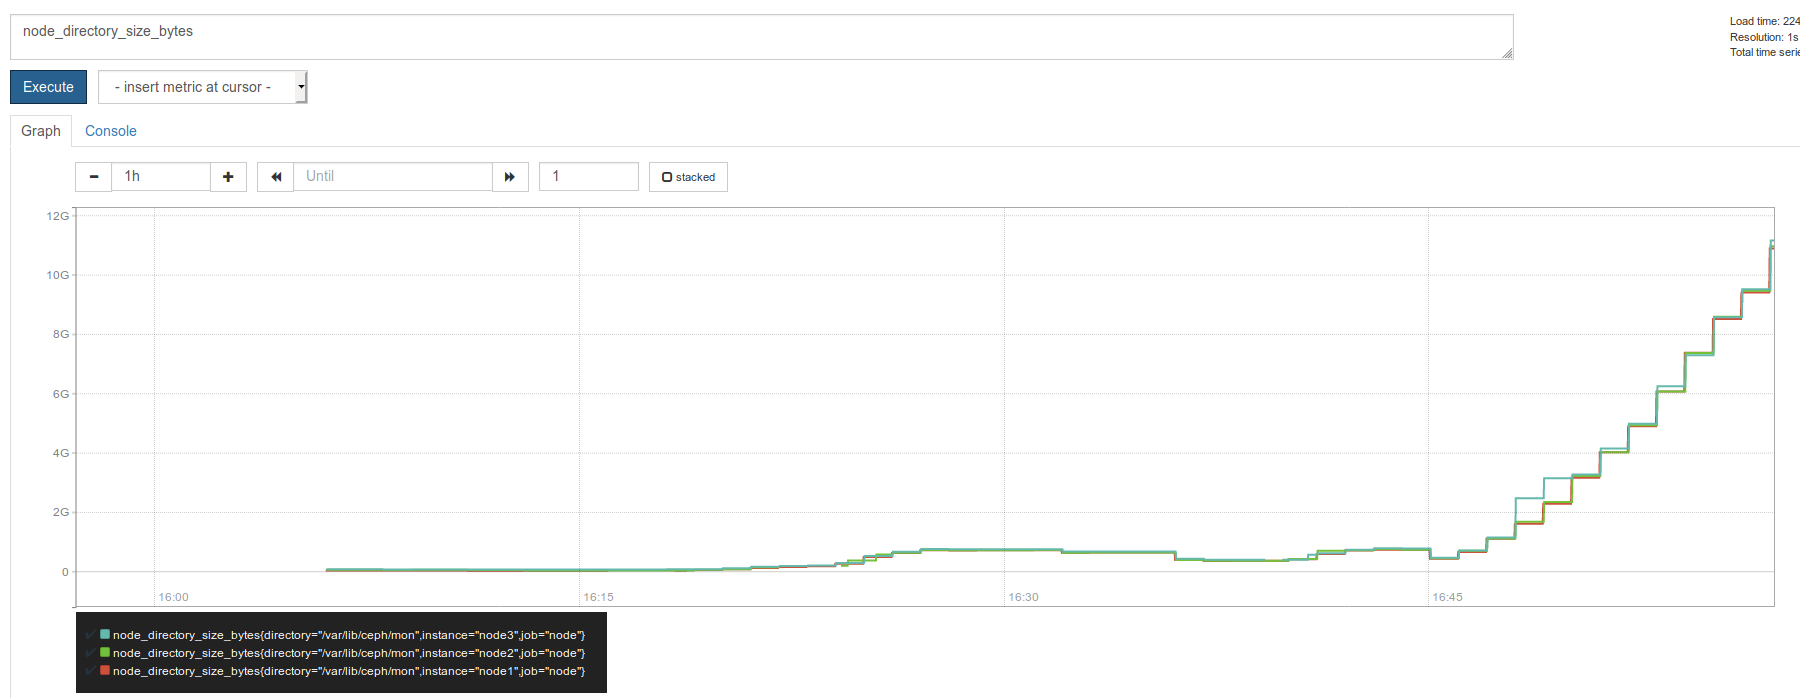
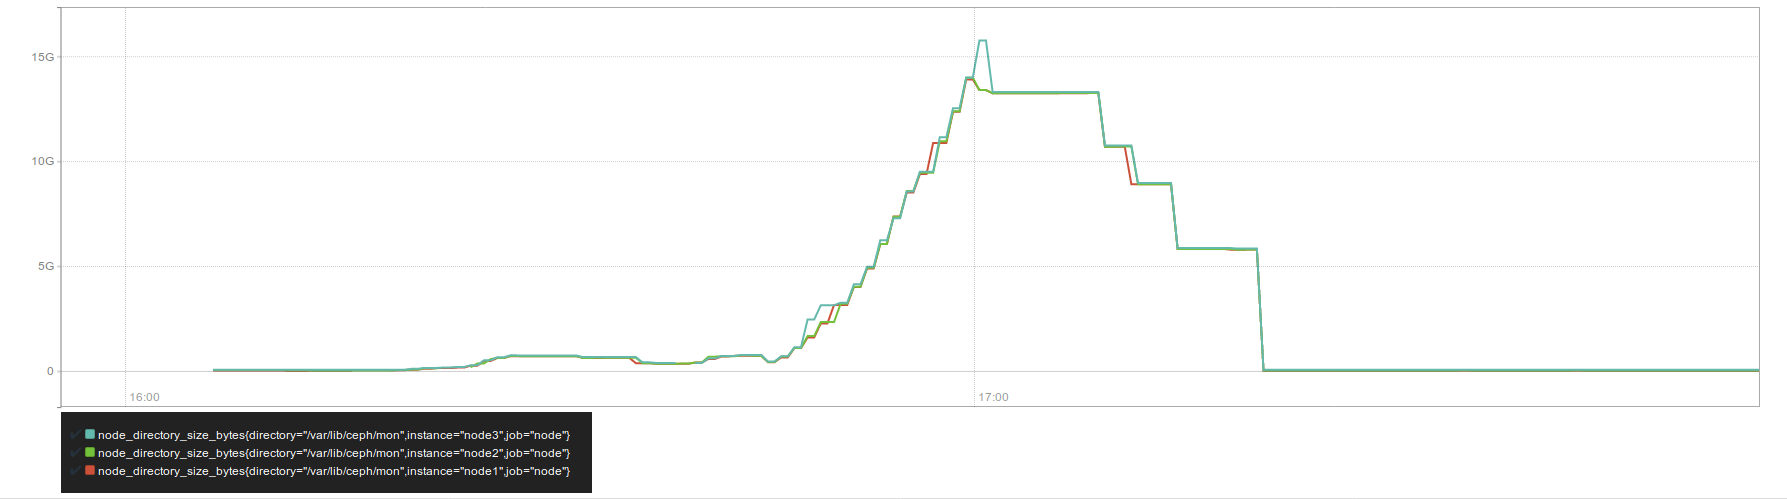
4. I've written Prometheus collector that collects size of /var/lib/ceph/mon directory. See one more picture.
Updated by Марк Коренберг almost 5 years ago
This one rapid growth happened after rebooting an OSD node. Interesting, this node has filestore OSDs and Nautilus run `chown -R` at the start of an OSD., so that's why cluster state was not active+clean too long.
Growth also happens on other OSDs restart, but they are bluestore and restart quickly.
Also, `ceph osd out` DOES NOT lead to DB growth.
Updated by Марк Коренберг almost 5 years ago
Is any way to dump Monitor DB contents ?
Updated by Josh Durgin almost 5 years ago
With a monitor stopped, you can run e.g.
ceph-monstore-tool /var/lib/ceph/mon/ceph-a/ dump-keys > key_file- I expect you'll see some large difference in types of keys present before and after the mon db growth.
Updated by Марк Коренберг almost 5 years ago
Updated by Марк Коренберг almost 5 years ago
Well, I swtched off one node, and saw that after roughly 2 minutes, DB became to grow.
Next, I shut down one os the mons, copied it's dir and started it back, next, I switched on node again. DB returned to initial size. But now I have a copy of bloated DB.
Next, I run:
ceph-monstore-tool /var/lib/ceph/mon/zzzzzzzzzzz compact
It did compaction, bit size did not reduce significantly.
Unfortunately, I seems to spoil db by command `ceph-monstore-tool /var/lib/ceph/mon/zzzzzzzzzzz rewrite-crush`, but I'm not sure what it does.
I did all possible dumps using the command (saved to separate files) and will attach them, as well as DB itself.
Updated by Марк Коренберг almost 5 years ago
Updated by Марк Коренберг almost 5 years ago
.tar.xz with mon DB
https://drive.google.com/file/d/1vUnKlJ2DXIN5sG2EKrJe3PFPVD_f8qpg
Also, Ive compiled RocksDB tools ( https://github.com/facebook/rocksdb.git ) and run:
./ldb --db=zzzzzzzzzzz/store.db dump --hex > somedump
gives about 4 GB in size (since every byte is represented as two hex symbols)
Please help me in DB content analysis.
Updated by Марк Коренберг almost 5 years ago
$ ./ldb --db=zzzzzzzzzzz/store.db scan | wc -l
7201
$ ./ldb --db=zzzzzzzzzzz/store.db scan | wc -c
203477
$ ./ldb --db=zzzzzzzzzzz/store.db dump --hex | wc -l
7112 somedump.hex
$ ./ldb --db=zzzzzzzzzzz/store.db dump --hex | wc -c
4298956894
Updated by Марк Коренберг almost 5 years ago
This is a list of top N key with their value size in MB:
b'logm\x00full_33478572' 14.130637168884277
b'logm\x00full_33478573' 14.130672454833984
b'paxos\x0080459057' 14.13127326965332
b'paxos\x0080459059' 14.132275581359863
b'paxos\x0080459061' 14.131123542785645
b'paxos\x0080459045' 13.510034561157227
b'logm\x00full_33478568' 12.28122329711914
b'logm\x00full_33478569' 12.281198501586914
b'logm\x00full_33478570' 12.281255722045898
b'logm\x00full_33478571' 12.281230926513672
b'paxos\x0080459048' 12.2816743850708
b'paxos\x0080459050' 12.28283405303955
b'paxos\x0080459053' 12.281706809997559
b'logm\x00full_33478564' 11.733987808227539
b'logm\x00full_33478565' 11.733963012695312
b'logm\x00full_33478566' 11.734020233154297
b'logm\x00full_33478567' 11.73399543762207
b'paxos\x0080459022' 11.197884559631348
b'paxos\x0080459034' 11.736038208007812
b'paxos\x0080459037' 11.7344388961792
b'paxos\x0080459041' 11.73559856414795
b'paxos\x0080459043' 11.734471321105957
b'logm\x00full_33478558' 10.03214168548584
b'logm\x00full_33478559' 10.03214168548584
b'logm\x00full_33478560' 10.03217887878418
b'logm\x00full_33478561' 10.032154083251953
b'logm\x00full_33478562' 10.032154083251953
b'logm\x00full_33478563' 10.032129287719727
b'paxos\x0080458989' 10.116427421569824
b'paxos\x0080459005' 10.661810874938965
b'paxos\x0080459023' 10.032552719116211
b'paxos\x0080459025' 10.034005165100098
b'paxos\x0080459027' 10.03262996673584
b'paxos\x0080459029' 10.03256607055664
b'paxos\x0080459032' 10.032605171203613
b'logm\x00full_33478540' 9.096428871154785
b'logm\x00full_33478541' 9.096427917480469
b'logm\x00full_33478542' 9.096403121948242
b'logm\x00full_33478543' 9.096403121948242
b'logm\x00full_33478544' 9.096402168273926
Updated by Марк Коренберг almost 5 years ago
I figured out. It was mgr module "insights". It writes tons of data in that case. Disabling module helps. So:
Please update documentation: add tha enabling this module leads to enormously HUGE mon DB size increase in non active+clean state.
The most scary thing that enabling this module in normal state does nothing. And during catastrophe it makes things much worse than they could be. I had to stop my cluster unexpectedly during minor operations due to this bug. It's very dangerous module.
Updated by Josh Durgin almost 5 years ago
- Project changed from RADOS to mgr
- Category set to insights module
- Assignee set to Noah Watkins
Noah can you take a look?
Updated by Noah Watkins almost 5 years ago
Hi,
It is conceivable that a bug in insights could cause a huge number of keys to be created, but I'm not seeing any evidence of this. The only keys related to insights in your mon keys file dump sare
mon_config_key / mgr/insights/health_history/2019-06-14_06
mon_config_key / mgr/insights/health_history/2019-06-14_07
mon_config_key / mgr/insights/health_history/2019-06-14_08
mon_config_key / mgr/insights/health_history/2019-06-14_09
mon_config_key / mgr/insights/health_history/2019-06-15_11
is it possible to look in your database to see how much space is being occupied by those key/value pairs?
Is it possible to reenable the insights module and collect the monitor log with debug logging turned up?
Updated by Nathan Cutler almost 5 years ago
- Related to Bug #40385: Ceph mgr `insights` uses mon DB as a storage. added
Updated by Nathan Cutler almost 5 years ago
- Related to deleted (Bug #40385: Ceph mgr `insights` uses mon DB as a storage.)
Updated by Nathan Cutler almost 5 years ago
- Has duplicate Bug #40385: Ceph mgr `insights` uses mon DB as a storage. added
Updated by Josh Durgin almost 5 years ago
The logm keys being that large suggests there were many messages sent to the cluster log in a short span of time. Is it possible for the insights module to do this? (As an aside, keeping the central log in the monitor db is not ideal, but a bigger project to fix and tougher to backport than limiting log producers).
Updated by Noah Watkins almost 5 years ago
Josh, can you speak a little more about the types of messages related to `logm` keys? It's conceivable that some issue with the insights module is causing a lot of communication, but it would help to narrow down what I'm looking for.
Updated by Josh Durgin almost 5 years ago
It's storing log messages for the central log, which are also output to the ceph.log file. Is there anything output there from insights when an OSD goes down/up?
Updated by Noah Watkins almost 5 years ago
Oh, you mean log messages like debug/info etc... I was thinking you meant that with any communication with the monitor log messages would be generated as a side affect. Is there a different variant of logging that sends logs to the monitor vs the local mgr daemon log?
Updated by Josh Durgin almost 5 years ago
As I understand it, within a mgr module self.log goes to the mgr's local log file, and self.cluster_log() would go to the monitor. It appears the latter isn't used very much, so if it's coming from insights it'd be an indirect effect, e.g. from adding/removing a health warning, or running a monitor command (which would be added to the monitor's audit log), or something else I'm not thinking of now.
Марк Коренберг - do you have any ceph.log or audit.log from a time period when you were seeing the mon store grow?
Updated by Noah Watkins almost 5 years ago
Thanks Josh. I'll do a quick audit with this info.
Updated by Noah Watkins over 4 years ago
While we don't track much data in the insights module, it looks like the issue here is that the state managed by the insights module is frequently flushed to the monitor's key-value store which the manager implements as a monitor `config-key set` command. That fits with Josh's hint about it being an indirect source.
We can do two things to improve the situation:
(1) decrease the frequency of flushing from 10 seconds to ??? even a couple minutes is probably fine.
(2) the state tracked are various health checks that have been observed. checking for changes since last write should be very effective.
Updated by Kefu Chai over 4 years ago
- Assignee changed from Noah Watkins to Kefu Chai
Updated by Kefu Chai over 4 years ago
- Assignee changed from Kefu Chai to Brad Hubbard
Updated by Brad Hubbard over 4 years ago
- Status changed from New to 4
Noah Watkins wrote:
While we don't track much data in the insights module, it looks like the issue here is that the state managed by the insights module is frequently flushed to the monitor's key-value store which the manager implements as a monitor `config-key set` command. That fits with Josh's hint about it being an indirect source.
We can do two things to improve the situation:
(1) decrease the frequency of flushing from 10 seconds to ??? even a couple minutes is probably fine.
(2) the state tracked are various health checks that have been observed. checking for changes since last write should be very effective.
I've only just strted lookingat this code but I guess you could test (1) by removing /usr/share/ceph/mgr/insights/health.pyc and changing the following line in /usr/share/ceph/mgr/insights/health.py.
PERSIST_PERIOD = datetime.timedelta(seconds = 10)
Change it to the following.
PERSIST_PERIOD = datetime.timedelta(seconds = 120)
Let us know how it goes.
Updated by Brad Hubbard over 4 years ago
- Status changed from New to Need More Info
Updated by Sage Weil over 4 years ago
- Priority changed from Immediate to Urgent
Updated by Sage Weil about 4 years ago
- Status changed from Need More Info to Resolved
I think this is okay now?