Bug #39650
closedmgr/dashboard: Pool graph/sparkline points do not display the correct values
0%
Description
When hovering with the cursor over the points displayed in the graphs of pools, the values displayed are always the same for each point. In addition to that, the values displayed seem to be wrong, too. I cannot explain why there's so much traffic on a RBD of my test cluster, although I didn't do anything that would explain that. The latter problem was also initially reported by mrf3.

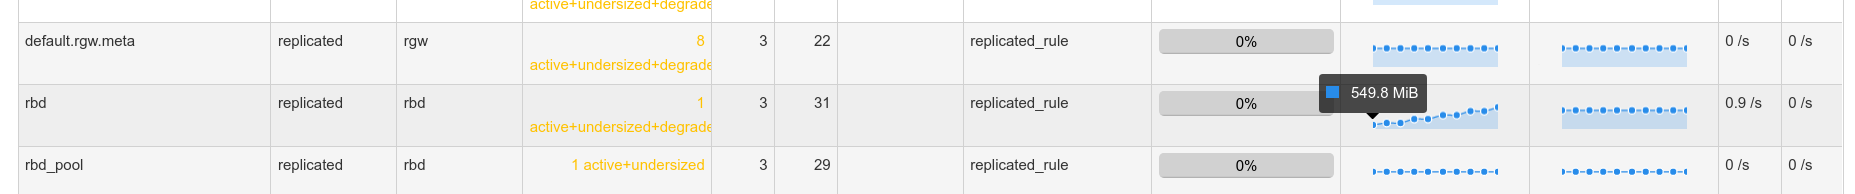

Provided by mrf3:

Files
Updated by Patrick Seidensal almost 5 years ago
- Subject changed from mgr/dashboard: Pool graph points do not display the correct values to mgr/dashboard: Pool graph/sparkline points do not display the correct values
Updated by Lenz Grimmer almost 5 years ago
I think the key point is that the values "Read bytes" and "Write bytes" are simple incrementing counters that display the total amount of data that has been read and written from/to a specific pool. So this is a number that is constantly increasing - I'm not sure if the current charts really provide a useful visualization here.
I think it would be much better to replace that graph with a value in human-readable units (not plain bytes) and rather replace the values displayed in the following columns (Read ops and write ops) with such a chart, as they are more likely to vary over short time periods (and it would provide much more valuable insight to have a time series of data here to visualize an drastic increase or decrease in any of these).
Thoughts?
Updated by Lenz Grimmer almost 5 years ago
- Translation missing: en.field_tag_list set to usability, monitoring
- Backport set to nautilus
- Affected Versions v14.2.1, v15.0.0 added
Updated by Stephan Müller almost 5 years ago
- Status changed from New to In Progress
Updated by Stephan Müller almost 5 years ago
I investigated it, it's not a bug as everything is working as intended.
This problem has 2 aspects that should be discussed here.
But before that I will light the shadow by concluding what happened here. There were minor changes going on that were less than 0.1 MB. Because they were happening chart wanted to indicated that a increase is going on.
So back to the two aspects, first aspect the chart shows even small changes. The second aspect, the tooltip only shows changes that a big enough depending on the dimension you are in.
Their are multiple ways to proceed from here.
Solution one would be to use a bigger precision in the label. But this also has the side effect that if the number is big enough you won't see small changes even if the chart reflects it.
The better solution tow is, to only show changes in the number, as read and write bytes will only increase it would be better to show sparks instead. Which we are already doing in the OSD page.
Hm... I thought this would not end up like a monologue, but as we already doing the alignment of the points on the OSD page, I will implement the same in the pools page.
Updated by Stephan Müller almost 5 years ago
- Status changed from In Progress to Fix Under Review
- Pull request ID set to 28153
Updated by Lenz Grimmer almost 5 years ago
- Status changed from Fix Under Review to Pending Backport
- Target version set to v15.0.0
Updated by Nathan Cutler almost 5 years ago
- Copied to Backport #40658: nautilus: mgr/dashboard: Pool graph/sparkline points do not display the correct values added
Updated by Stephan Müller over 4 years ago
- Blocks Backport #39604: mgr/dashboard: Allow the decrease of pg's of an existing pool added
Updated by Stephan Müller over 4 years ago
- Blocks deleted (Backport #39604: mgr/dashboard: Allow the decrease of pg's of an existing pool)
Updated by Ricardo Marques over 4 years ago
- Status changed from Pending Backport to Resolved
Updated by Ernesto Puerta about 3 years ago
- Project changed from mgr to Dashboard
- Category changed from 137 to Component - Pools