Bug #39618
closedRunaway memory usage on Bluestore OSD
0%
Description
It seems that memory usage on Bluestore OSD's in Nautilus is runaway or has a leak. Auto-tuning has no effect, and capping the cache to 1.5GB still results in OSD's using 4+GB after a day of use. I've pulled all the levers there are to pull without any change in behavior, leading me to believe this is a code bug.
My config:
root@cephmon1-4a:~ $ ceph config dump
WHO MASK LEVEL OPTION VALUE RO
mon.* advanced mon_osd_adjust_heartbeat_grace false
mon.* advanced osd_pool_erasure_code_stripe_unit 65536
osd.* dev bluestore_cache_autotune false
osd.* advanced osd_heartbeat_grace 40
osd.* basic osd_memory_target 1610612736
Files
Updated by Igor Fedotov almost 5 years ago
Richard, you have the following line in your config:
osd.* dev bluestore_cache_autotune false
Which disables cache autotuning, is that correct?
Updated by Richard Hesse almost 5 years ago
Igor Fedotov wrote:
Richard, you have the following line in your config:
osd.* dev bluestore_cache_autotune falseWhich disables cache autotuning, is that correct?
Correct. I tried working the osd_memory_target down bit by bit, but it had no effect. Believing that the auto-tuning had a defect, I disabled it. The OSD should then use the default cache size value:
$ ceph daemon osd.80 config get bluestore_cache_size_hdd
{
    "bluestore_cache_size_hdd": "1073741824"
}
I realize that OSD process will use memory for things other than cache, but they're running about 3.5-4GB of RSS now (and still getting OOM killed).
Updated by Richard Hesse almost 5 years ago
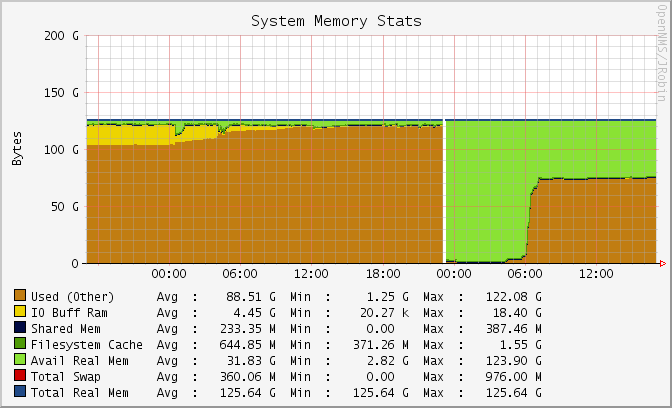
Attaching an image showing memory consumption between Nautilus and Luminous on identical hardware and indentical configs.
Nautilus is on the left and Luminous is on the right. We had to revert back to Luminous for this cluster because of this bug.
Configs are generally identical. The only difference is that the auto-tuning is enable in Luminous and set to 3GB.
Updated by Mark Nelson almost 5 years ago
Hi Richard,
Sorry for the long latency on this reply! Setting the osd_memory_target won't do anything if you disable autotuning, so you will be back to setting the cache size and dividing it up using the various ratios. If you are still having this problem, you can try to diagnose what the autotuner is doing by setting debug_bluestore = 5 and debug_prioritycache = 5 and looking for lines that look roughly like this in the osd log:
2019-07-18T19:34:42.587-0400 7f4048b8d700  5 prioritycache tune_memory target: 4294967296 mapped: 4260962304 unmapped: 856948736 heap: 5117911040 old mem: 2845415707 new mem: 2845415707
2019-07-18T19:34:33.527-0400 7f4048b8d700  5 bluestore.MempoolThread(0x55a6d330ead0) _resize_shards cache_size: 2845415707 kv_alloc: 1241513984 kv_used: 874833889 meta_alloc: 1258291200 meta_used: 889040246 data_alloc: 318767104 data_used: 0
The first line will tell you what your memory target is set to, how much memory is currently mapped, how much is unmapped (ie what's been freed but the kernel hasn't reclaimed), the total heap size, and the old and new aggregate size for all of bluestores caches. The second line also tells you the aggregate cache size, and then how much space is being allocated and used for the kv, meta, and data caches. If there's a leak somewhere in the OSD or bluestore the autotuner will shrink the cache way down but eventually won't be able to contain it and eventually your process will start growing beyond the target size despite having a tiny amount of bluestore cache. If it's something else like a huge amount of freed memory not being reclaimed by the kernel, you'll see large amount of unmapped memory and a big heap size despite the mapped memory staying near the target. If it's a bug in the autotuner, we might see the mapped memory greatly exceeding the target.
Mark
Updated by Richard Hesse almost 5 years ago
I'm no longer running nautilus (or trying to run it), so I can't get more additional information. I was just reporting the issue. We had auto-tuning disabled and had "bluestore_cache_size_hdd": "1073741824" in the config. That should keep things fairly stable around the 1073741824 mark per OSD, yeah? Maybe even see 20-40% higher than that value, but I wouldn't expect to see it go 300% above.
We're fairly stable on Luminous again with this cluster, so I don't think Nautilus will be in the cards for some time.
I guess you can close this bug if there's nothing obvious jumping out in the code. I just wanted to report it.
Updated by Mark Nelson over 4 years ago
- Status changed from New to Can't reproduce
Since we can't reproduce this in-house, I'm going to close this bug for now. With a 1GB cache I'd typically expect anywhere from 1.5-2.5GB of OSD memory usage depending on various factors. The likely contributors would be pglog memory growth, unmapped memory the kernel failed to reclaim, or rocksdb WAL buffers. Please feel free to reopen or submit a new one if you hit this again in the future!
Updated by Richard Hesse about 4 years ago
I'm not sure why, but enabling the balancer module has solved the memory bug. Everything got smooth and stable once balancer ran (in crush compat mode).