Bug #39133
openCeph-Mgr-Dashboard had problem with grafana-server
0%
Description
My grafana-server used https protocol but ceph-mgr-dashboard can't set any ssl parameter with "ceph dashboard set-grafana-api" now there's 3 values that can set
username, paswword and url. And one more thing ceph dashboard document is extremely confused.
In ceph document is this block
***********************************************************************
ceph dashboard set-grafana-api-url <grafana-server-url> # default: ''
The format of url is : <protocol>:<IP-address>:<port>
It should be <protocol>://<IP-address>:<port>
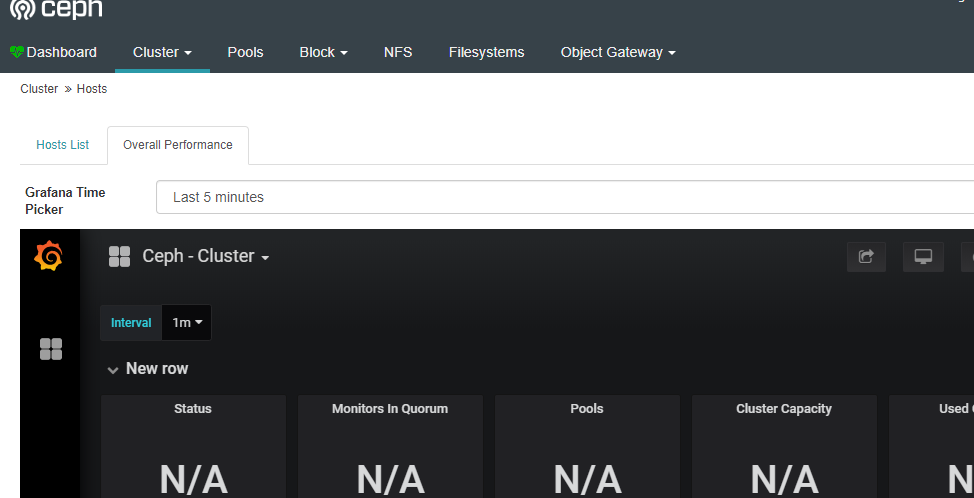
When I reconfigure my grafana to HTTP, not working it shown no dashboard existing.
This follow is shown.
2019-04-07 01:26:03.128 7f1a63d2a700 0 mgr[dashboard] ['{"status": "500 Internal Server Error", "version": "8.9.1", "detail": "The server encountered an unexpected condition which prevented it from fulfilling the request.", "traceback": "Traceback (most recent call last):\\n File \\"/usr/lib/python2.7/dist-packages/cherrypy/_cprequest.py\\", line 670, in respond\\n response.body = self.handler()\\n File \\"/usr/lib/python2.7/dist-packages/cherrypy/lib/encoding.py\\", line 220, in call\\n self.body = self.oldhandler(*args, **kwargs)\\n File \\"/usr/lib/python2.7/dist-packages/cherrypy/_cptools.py\\", line 237, in wrap\\n return self.newhandler(innerfunc, *args, **kwargs)\\n File \\"/usr/share/ceph/mgr/dashboard/services/exception.py\\", line 88, in dashboard_exception_handler\\n return handler(*args, **kwargs)\\n File \\"/usr/lib/python2.7/dist-packages/cherrypy/_cpdispatch.py\\", line 60, in call\\n return self.callable(*self.args, **self.kwargs)\\n File \\"/usr/share/ceph/mgr/dashboard/controllers/__init__.py\\", line 649, in inner\\n ret = func(*args, **kwargs)\\n File \\"/usr/share/ceph/mgr/dashboard/controllers/grafana.py\\", line 37, in validation\\n response = grafana.url_validation(method, url)\\n File \\"/usr/share/ceph/mgr/dashboard/controllers/grafana.py\\", line 16, in url_validation\\n path)\\n File \\"/usr/lib/python2.7/dist-packages/requests/api.py\\", line 58, in request\\n return session.request(method=method, url=url, **kwargs)\\n File \\"/usr/lib/python2.7/dist-packages/requests/sessions.py\\", line 520, in request\\n resp = self.send(prep, **send_kwargs)\\n File \\"/usr/lib/python2.7/dist-packages/requests/sessions.py\\", line 630, in send\\n r = adapter.send(request, **kwargs)\\n File \\"/usr/lib/python2.7/dist-packages/requests/adapters.py\\", line 506, in send\\n raise SSLError(e, request=request)\\nSSLError: HTTPSConnectionPool(host=\'10.11.154.1\', port=3000): Max retries exceeded with url: /api/dashboards/uid/lxnjcTAmk (Caused by SSLError(SSLError(1, u\'[SSL: CERTIFICATE_VERIFY_FAILED] certificate verify failed (_ssl.c:726)\'),))\\n"}']
Files
Updated by Prince Inamatus about 5 years ago
Korrakot Surakul wrote:
My grafana-server used https protocol but ceph-mgr-dashboard can't set any ssl parameter with "ceph dashboard set-grafana-api" now there's 3 values that can set
username, paswword and url. And one more thing ceph dashboard document is extremely confused.In ceph document is this block
***********************************************************************
ceph dashboard set-grafana-api-url <grafana-server-url> # default: ''The format of url is : <protocol>:<IP-address>:<port>
It should be <protocol>://<IP-address>:<port>
This follow is shown.
2019-04-07 01:26:03.128 7f1a63d2a700 0 mgr[dashboard] ['{"status": "500 Internal Server Error", "version": "8.9.1", "detail": "The server encountered an unexpected condition which prevented it from fulfilling the request.", "traceback": "Traceback (most recent call last):\\n File \\"/usr/lib/python2.7/dist-packages/cherrypy/_cprequest.py\\", line 670, in respond\\n response.body = self.handler()\\n File \\"/usr/lib/python2.7/dist-packages/cherrypy/lib/encoding.py\\", line 220, in call\\n self.body = self.oldhandler(*args, **kwargs)\\n File \\"/usr/lib/python2.7/dist-packages/cherrypy/_cptools.py\\", line 237, in wrap\\n return self.newhandler(innerfunc, *args, **kwargs)\\n File \\"/usr/share/ceph/mgr/dashboard/services/exception.py\\", line 88, in dashboard_exception_handler\\n return handler(*args, **kwargs)\\n File \\"/usr/lib/python2.7/dist-packages/cherrypy/_cpdispatch.py\\", line 60, in call\\n return self.callable(*self.args, **self.kwargs)\\n File \\"/usr/share/ceph/mgr/dashboard/controllers/__init__.py\\", line 649, in inner\\n ret = func(*args, **kwargs)\\n File \\"/usr/share/ceph/mgr/dashboard/controllers/grafana.py\\", line 37, in validation\\n response = grafana.url_validation(method, url)\\n File \\"/usr/share/ceph/mgr/dashboard/controllers/grafana.py\\", line 16, in url_validation\\n path)\\n File \\"/usr/lib/python2.7/dist-packages/requests/api.py\\", line 58, in request\\n return session.request(method=method, url=url, **kwargs)\\n File \\"/usr/lib/python2.7/dist-packages/requests/sessions.py\\", line 520, in request\\n resp = self.send(prep, **send_kwargs)\\n File \\"/usr/lib/python2.7/dist-packages/requests/sessions.py\\", line 630, in send\\n r = adapter.send(request, **kwargs)\\n File \\"/usr/lib/python2.7/dist-packages/requests/adapters.py\\", line 506, in send\\n raise SSLError(e, request=request)\\nSSLError: HTTPSConnectionPool(host=\'10.11.154.1\', port=3000): Max retries exceeded with url: /api/dashboards/uid/lxnjcTAmk (Caused by SSLError(SSLError(1, u\'[SSL: CERTIFICATE_VERIFY_FAILED] certificate verify failed (_ssl.c:726)\'),))\\n"}']
When I reconfigure my grafana to HTTP, not working it shown no dashboard existing.
Updated by ZZHI LAN about 5 years ago
- File ceph dashboard.png ceph dashboard.png added
In ceph document is this block
***************************************************************
ceph dashboard set-grafana-api-url <grafana-server-url> # default: ''
The format of url is : <protocol>:<IP-address>:<port>
***********************************************************
It should be the grafana home page or other else, not only <protocol>://<IP-address>:<port> . Just like this: <protocol>://<IP-address>:<port>/?orgId=1
Tt works for me, good lucky!
Updated by Ernesto Puerta about 3 years ago
- Project changed from mgr to Dashboard
- Category changed from 148 to Monitoring