Bug #3883
closedosd: leaks memory (possibly triggered by scrubbing) on argonaut
0%
Description
100MB/day reported by multiple users, both on 0.48 and 0.56.1.
Some correlation with scrubbing. Possibly specific to the RBD pool.
See ML thread 'Re: [0.48.3] OSD memory leak when scrubbing'
Files
Updated by Sage Weil about 11 years ago
- Subject changed from osd: new memory leak in wip-f? to osd: leaks memory (possibly triggered by scrubbing)
- Description updated (diff)
- Priority changed from High to Urgent
- Source changed from Development to Community (user)
Updated by Samuel Just about 11 years ago
The burnupi57 cluster (wip-f) does not appear to be leaking after all, the osds seem to have leveled off at around 350MB of memory. I left the profiler running for two days for osd.1 and the heap appears to have not grown at all in that time on osd.1. The burnupi 15 cluster running wip_bobtail_f (56 series) also does not appear to be leaking (still watching). Both appear to be scrubbing regularly.
Updated by Sylvain Munaut about 11 years ago
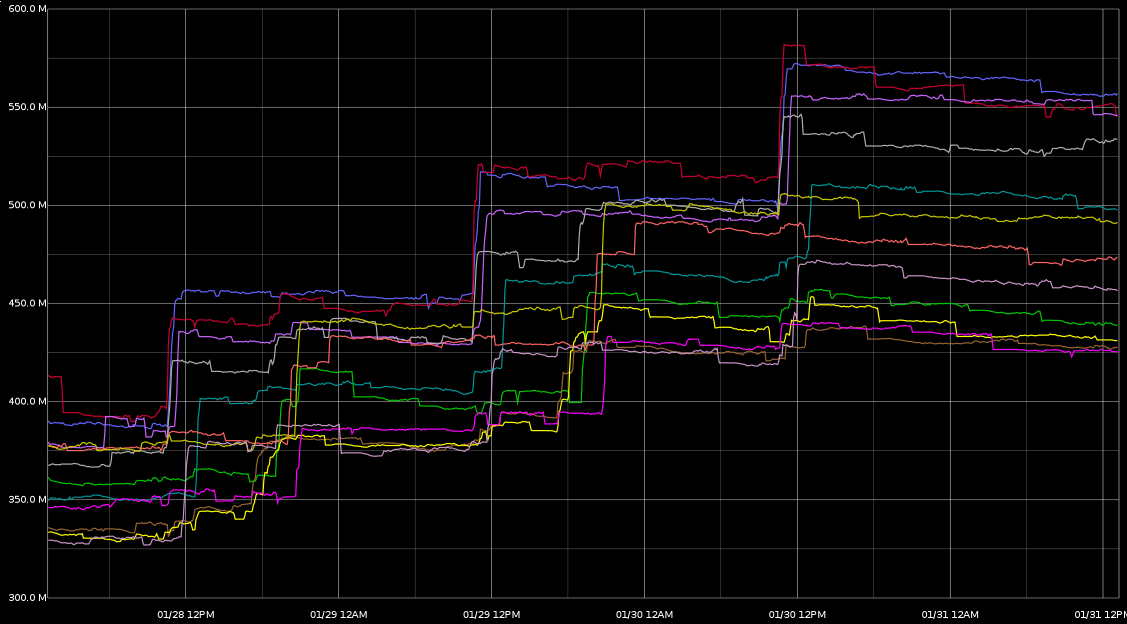
- File osd_mem_noscrub.png osd_mem_noscrub.png added
I disabled scrubbing using
ceph osd tell \* injectargs '--osd-scrub-min-interval 1000000'
ceph osd tell \* injectargs '--osd-scrub-max-interval 10000000'
and the leak seems to be gone.
See the graph with the OSD memory for the 12 osd processes over the last 3.5 days. Memory was rising every 24h. I did the change yesterday around 13h00 and OSDs stopped growing. OSD memory even seems to go down slowly by small blocks.
Updated by Wido den Hollander about 11 years ago
I've also started to see this and will try to get some heap profiling done to report back.
- ceph version 0.56.1 (e4a541624df62ef353e754391cbbb707f54b16f7
- kernel version 3.2.0-36-generic
- OSD filesystem: btrfs
In this case it's RBD running behind CloudStack, so regular KVM, no kernel RBD.
It was a 32GB machine with just two OSDs which started swapping (16GB) and eventually went OOM.
To be sure that I collect the right information:
I see osd.7 go wild and do:
ceph osd tell 7 heap start_profiler
ceph osd tell 7 heap dump
ceph osd tell 7 heap stop_profiler
kill -SEGV <osd.7's pid>
That would give me a heap file and core, correct?
Updated by Josh Durgin about 11 years ago
On wip-f, one osd grew to consume 70% of ram. The heap profiler tells us:
(pprof) top20
Total: 2.5 MB
     1.9  75.4%  75.4%      1.9  75.4% ceph::log::Log::create_entry
     0.6  24.5%  99.9%      0.6  24.5% std::string::_Rep::_S_create
     0.0   0.1% 100.0%      0.0   0.3% ceph_heap_profiler_handle_command
     0.0   0.0% 100.0%      0.0   0.0% std::deque::_M_push_back_aux
     0.0   0.0% 100.0%      0.0   0.2% LogClient::do_log
     0.0   0.0% 100.0%      0.0   0.0% MMonCommand::print
     0.0   0.0% 100.0%      0.0   0.0% MMonSubscribeAck::print
     0.0   0.0% 100.0%      0.0   0.0% MOSDMap::print
     0.0   0.0% 100.0%      0.1   4.1% MOSDPing::print
Updated by Greg Farnum about 11 years ago
Oh, how interesting...I wonder if this is syslog not having enough network bandwidth? Or (in the more general sense) logging messages not getting out of the OSD process and into the target due to throughput issues which are triggered by additional activity from scrub?
Updated by Greg Farnum about 11 years ago
Something like that (or some kind of bug in the logging system that only gets hit with syslog or when not logging) would explain why we've been unable to reproduce locally but others have been seeing it so consistently, fyi.
Updated by Josh Durgin about 11 years ago
A log dump shows nothing, so I'm guessing the log is corrupted such that it keeps logging to more and more memory without bound.
ubuntu@burnupi57:~$ sudo ceph --admin-daemon /var/run/ceph/ceph-osd.1.asok log dump

ubuntu@burnupi57:~$
It's just using default log settings, so there's no syslog involved.
Updated by Josh Durgin about 11 years ago
(gdb) p *(g_ceph_context->_log)
$4 = {<Thread> = {_vptr.Thread = 0xb42910, thread_id = 140568769971968}, m_indirect_this = 0x3300010, m_subs = 0x330d090, m_lock = 1, m_queue_mutex = {__data = {
      __lock = 0, __count = 0, __owner = 0, __nusers = 1, __kind = 0, __spins = 0, __list = {__prev = 0x0, __next = 0x0}},
    __size = '\000' <repeats 12 times>, "\001", '\000' <repeats 26 times>, __align = 0}, m_flush_mutex = {__data = {__lock = 0, __count = 0, __owner = 0,
      __nusers = 4294967290, __kind = 0, __spins = 0, __list = {__prev = 0x0, __next = 0x0}},
    __size = '\000' <repeats 12 times>"\372, \377\377\377", '\000' <repeats 23 times>, __align = 0}, m_cond = {__data = {__lock = 0, __futex = 322509383,
      __total_seq = 161254692, __wakeup_seq = 161254691, __woken_seq = 161254691, __mutex = 0x3310028, __nwaiters = 2, __broadcast_seq = 0},
    __size = "\000\000\000\000G\032\071\023$\215\234\t\000\000\000\000#\215\234\t\000\000\000\000#\215\234\t\000\000\000\000(\000\061\003\000\000\000\000\002\000\000\000\000\000\000", __align = 1385167252638138368}, m_new = {m_len = 0, m_head = 0x0, m_tail = 0x0}, m_recent = {m_len = 1934, m_head = 0x8efea90, m_tail = 0x6719dd0},
  m_log_file = {static npos = <optimized out>, _M_dataplus = {<std::allocator<char>> = {<__gnu_cxx::new_allocator<char>> = {<No data fields>}, <No data fields>},
      _M_p = 0x330a858 "/var/log/ceph/ceph-osd.1.log"}}, m_fd = 6, m_syslog_log = -2, m_syslog_crash = -2, m_stderr_log = -1, m_stderr_crash = -1, m_stop = false,
  m_max_new = 1000000, m_max_recent = 10000}
Updated by Sage Weil about 11 years ago
the bit that looks fishy here is m_flush_mutex.__nusers. can you see what that thread is doing in gdb?
maybe it's not being initialized properly or something...
Updated by Sage Weil about 11 years ago
- Subject changed from osd: leaks memory (possibly triggered by scrubbing) to osd: leaks memory (possibly triggered by scrubbing) on argonaut
- Status changed from 12 to Won't Fix
Updated by Vladislav Gorbunov almost 11 years ago
simple workaround
run this command by cron, every 5 minutes:
for osd in $(cat /var/run/ceph/osd.*.pid | xargs -I {} ps -p {} -o pid,\%mem,args|grep -v PID | awk '{if ($2 > 50) print "memory leak on process: "$0}'|awk '{print $9}'); do ceph osd set noout && service ceph stop osd.$osd && sleep 30 && service ceph start osd.$osd && ceph osd unset noout; done
this script restart the osd process if used memory >50%