Feature #37387
closedmgr/dashboard: Add date range and log search functionality
0%
Description
With #24571 merged, the cluster and audit log have now been moved to a dedicated page on the dashboard.
To make the viewing of logs more useful, this page should provide some additional functionality to work with the logs, e.g. to search for keywords or to only show a certain time range.
Files
Updated by Lenz Grimmer over 5 years ago
- Due date set to 06/20/2018
- Start date changed from 11/26/2018 to 06/20/2018
- Follows Feature #24571: mgr/dashboard: Move Cluster/Audit logs from front page to dedicated "Logs" page added
Updated by Dan Guo about 5 years ago
- File logFilter.png logFilter.png added
How about if adding these filters for log page? For now, I just complete the html look. If it is looks good, I will continue complete the JS implementation.
Because of the upcoming Chinese New Year, my reply may be delayed and I will continue my ceph work after the holidays.
Thanks.
Updated by Lenz Grimmer about 5 years ago
Hi Dan, thank you for your message!
Dan Guo wrote:
How about if adding these filters for log page? For now, I just complete the html look. If it is looks good, I will continue complete the JS implementation.
Because of the upcoming Chinese New Year, my reply may be delayed and I will continue my ceph work after the holidays.
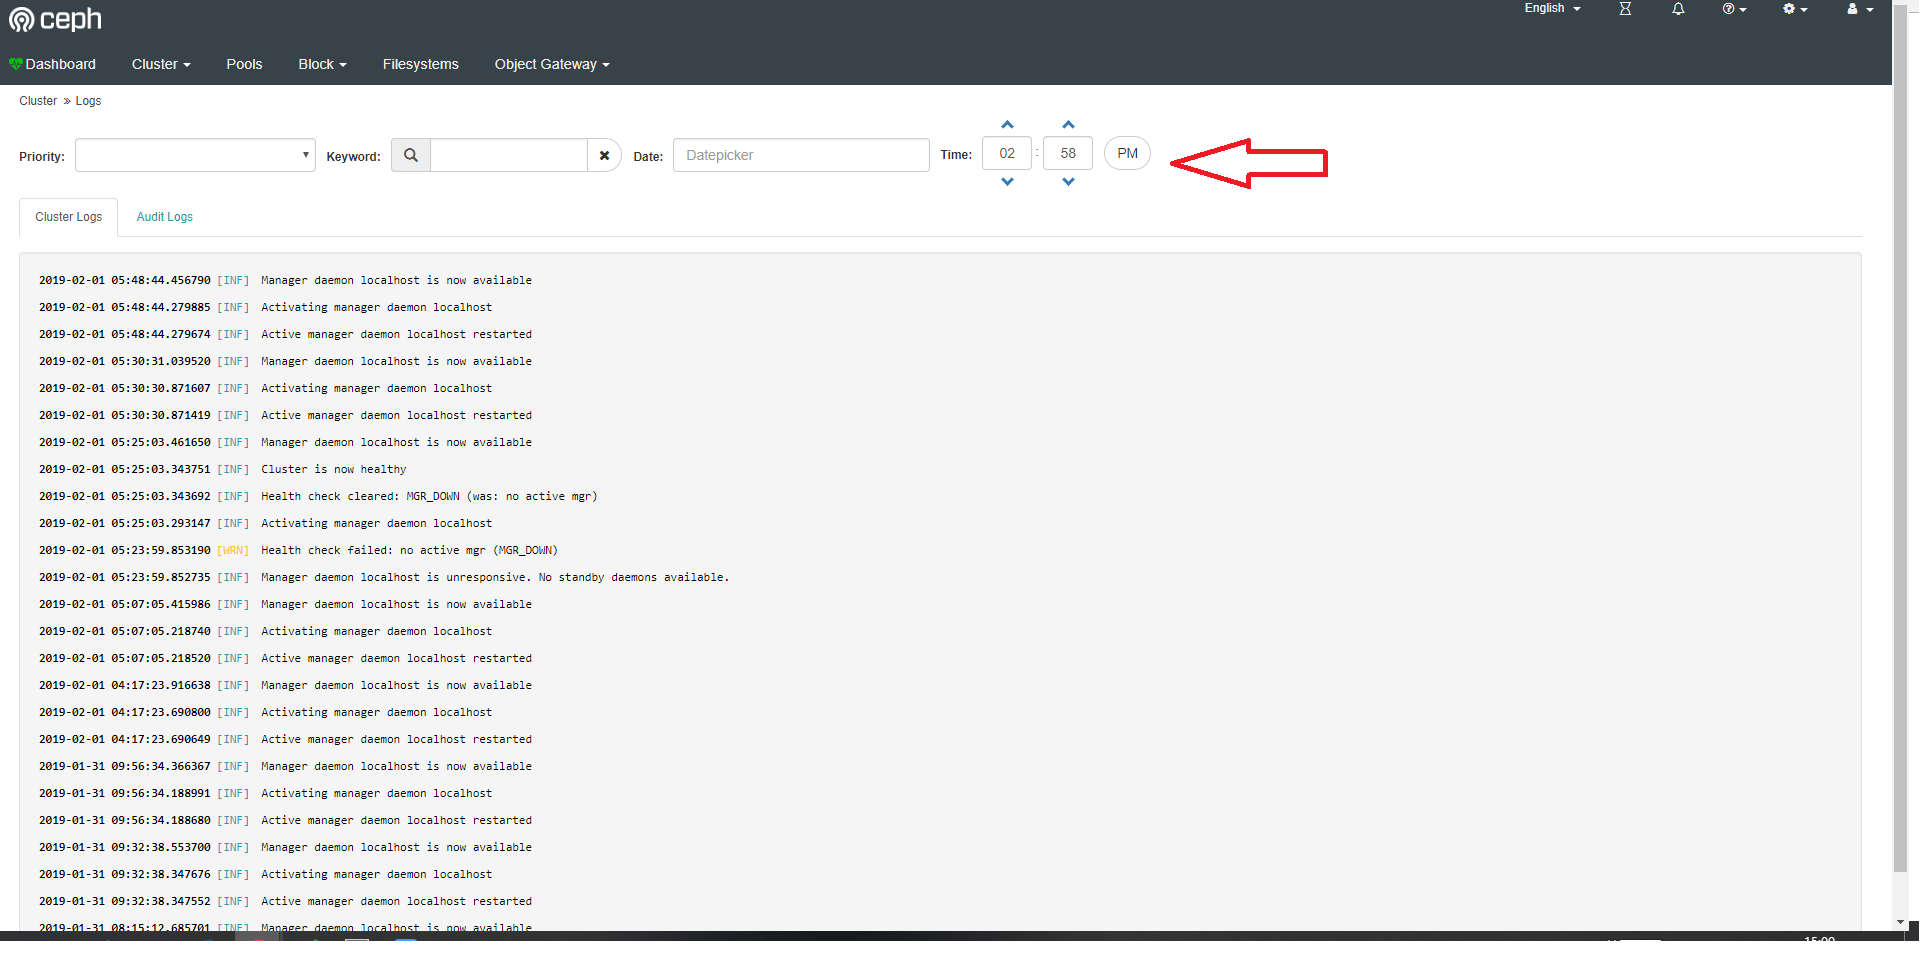
This looks promising already, thank you! I like that it's possible to filter by log level. It's great to be able to pick a single date/time, but what does this mean? Will it only display messages before or after this time? Would it be possible to add a selection box to select "before" and "after" next to the date/timepicker?
Updated by Laura Paduano about 5 years ago
Looks good to me! Maybe it would also make sense to have the option to set a timespan, for example when I only want to see the log output from 8 a.m. until 10 a.m. or so?
Updated by Dan Guo about 5 years ago
Laura Paduano wrote:
Looks good to me! Maybe it would also make sense to have the option to set a timespan, for example when I only want to see the log output from 8 a.m. until 10 a.m. or so?
Hi, I'm back. Implemented the time range filter.
I already sent a PR.
Updated by Dan Guo about 5 years ago
Updated by Lenz Grimmer about 5 years ago
- Status changed from New to Fix Under Review
- Assignee set to Dan Guo
- Pull request ID set to 26562
Updated by Lenz Grimmer about 5 years ago
- Status changed from Fix Under Review to Pending Backport
- Backport set to nautilus
Merged into master, let's add this to Nautilus as well.
Updated by Nathan Cutler about 5 years ago
- Copied to Backport #38878: nautilus: mgr/dashboard: Add date range and log search functionality added
Updated by Lenz Grimmer almost 5 years ago
- Status changed from Pending Backport to Resolved
Updated by Ernesto Puerta about 3 years ago
- Project changed from mgr to Dashboard
- Category changed from 148 to Monitoring