Bug #36740
closedmgr/dashboard: PG Stats, Pool usage and read/write ops missing from Pools table
0%
Description
With the update of the landing page to the new layout (#35691), the list of pools has been removed from the front page. However, the dedicated Pools table is currently missing some vital information that used to be visible on the landing page - it's no longer possible to obtain the current pool's PG status as well as the utilization and I/O operations statistics, which is a regression - this information should still be visible without having to install and configure Grafana and Prometheus.
Compare how this information was displayed before:

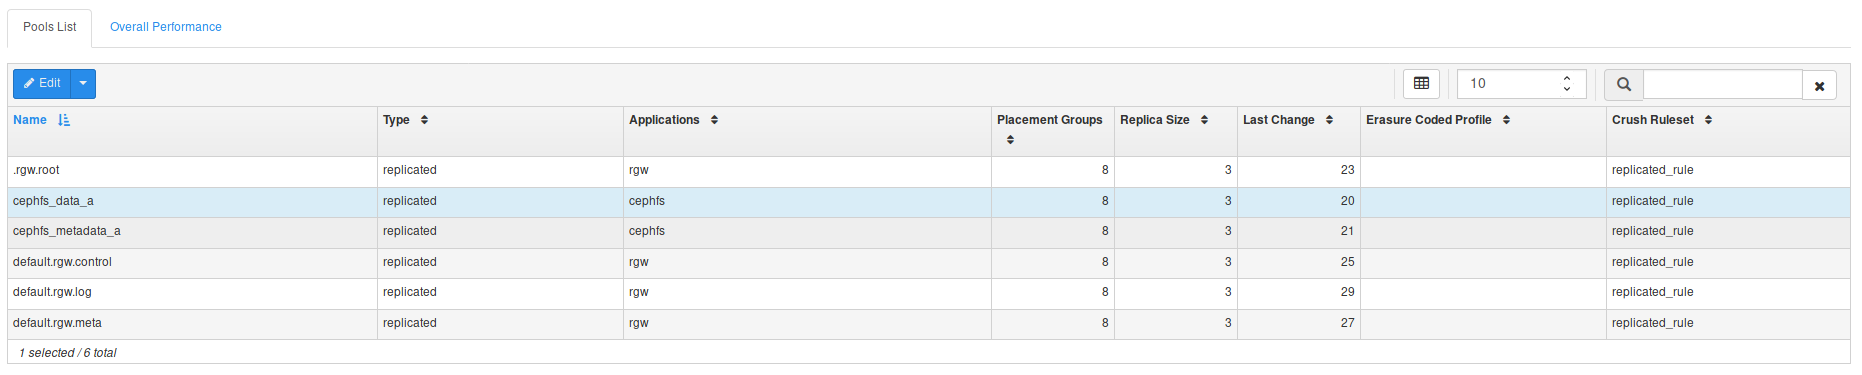
This is how the Pools are currently displayed:
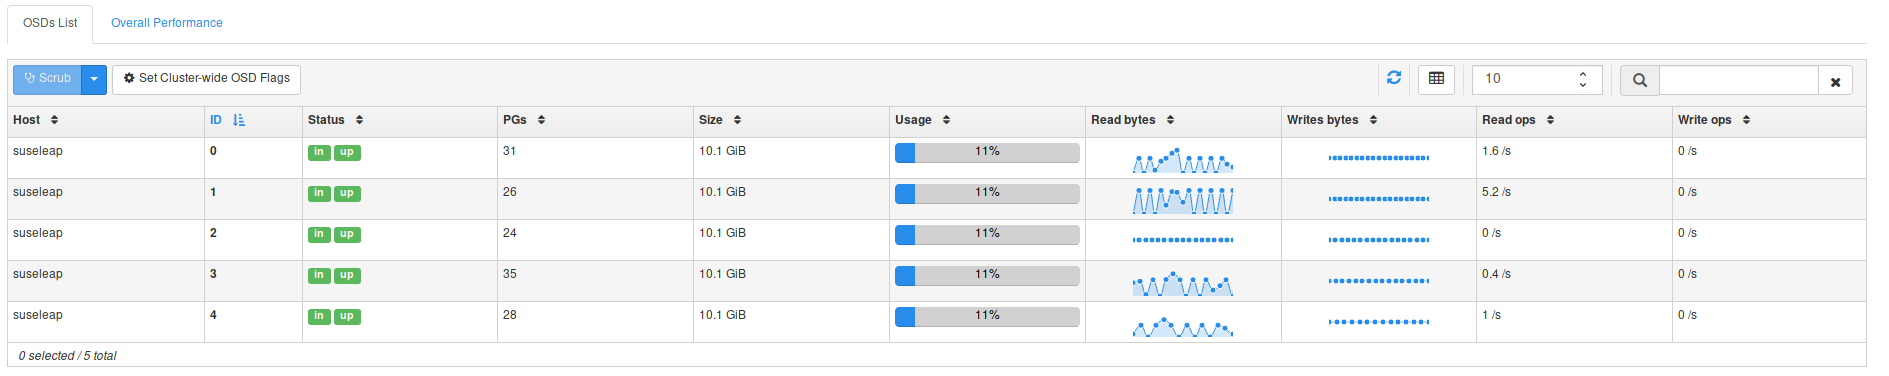
This information should be added to the Pools table, in a similar fashion on how it's implemented on the OSD table:
Files
Updated by Lenz Grimmer over 5 years ago
- Category set to 137
- Target version set to v14.0.0
Updated by Lenz Grimmer over 5 years ago
- Related to Bug #34320: mgr/dashboard: Read/Write OPS in pool stats always show 0 added
Updated by Lenz Grimmer over 5 years ago
- Related to Cleanup #35691: mgr/dashboard: Proposed Landing Page added
Updated by Lenz Grimmer over 5 years ago
There may be an open issue with actually obtaining some of the data - see #34320 for details. This might have to be revisited/fixed when this issue is being worked on.
Updated by Lenz Grimmer over 5 years ago
- Status changed from New to Fix Under Review
- Pull request ID set to 25489
Updated by Alfonso Martínez over 5 years ago
- Pull request ID changed from 25489 to 25791
PR 1: 25489 (merged)
PR 2: 25791
Updated by Lenz Grimmer over 5 years ago
- Status changed from Fix Under Review to Resolved
Updated by Ernesto Puerta about 3 years ago
- Project changed from mgr to Dashboard
- Category changed from 137 to Component - Pools